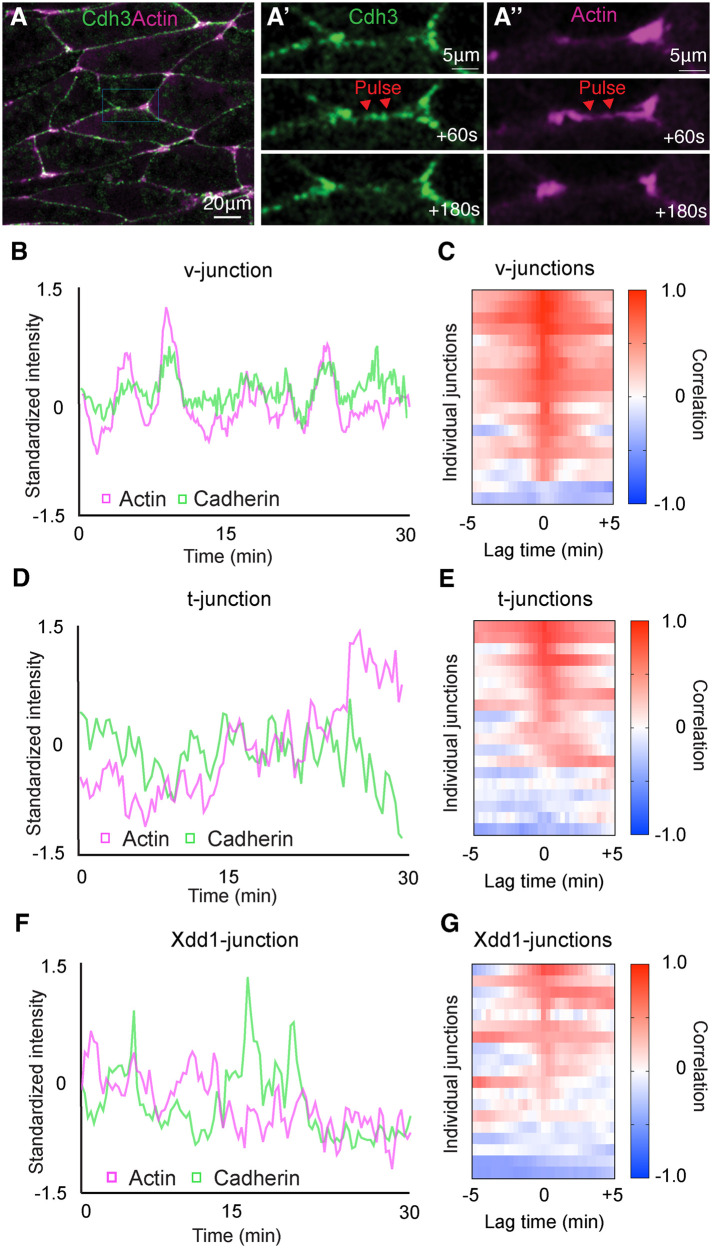
FIGURE 2:
PCP is required for synchronized cadherin and actin dynamics. (A) Frame from a time-lapse movie of intercalating cells labeled for Cdh3 in green and actin in magenta. (A′) Time series of Cdh3 from the inset in A. Here we are highlighting a shortening v-junction and showing that Cdh3 undergoes oscillatory pulses at said junctions. (A′′) Time series of actin from the inset in A. In this time series there is an actin pulse that occurs concurrently with the Cdh3 pulse shown in A′. (B) Graph plotting Cdh3 and actin intensity over time at a shortening v-junction. Here we observe concurrent peaks of Cdh3 and actin. Intensities were normalized to account for bleaching and then standardized to emphasize the overlap in the two signals over time. (C) Heatmap of the cross-correlation analysis for 19 shortening v-junctions. Each line on the y-axis of this heatmap represents the cross-correlation for a single shortening v-junction. The value of the correlation is represented in color code with red being positive correlation and blue being negative correlation. The x-axis shows the lag time, and the fact that we observe a high positive correlation at lag time 0 indicates that Cdh3 and actin pulses occur concurrently. (D) Graph plotting Cdh3 and actin intensities at t-junctions. (E) Heatmap of the cross-correlation analysis for 19 t-junctions. (F) Graph of Cdh3 and actin over time measured at junctions where Xdd1 was present in the background. (G) Heatmap of the cross-correlation analysis for 19 junctions with Xdd1 in the background.

