FIGURE 3:
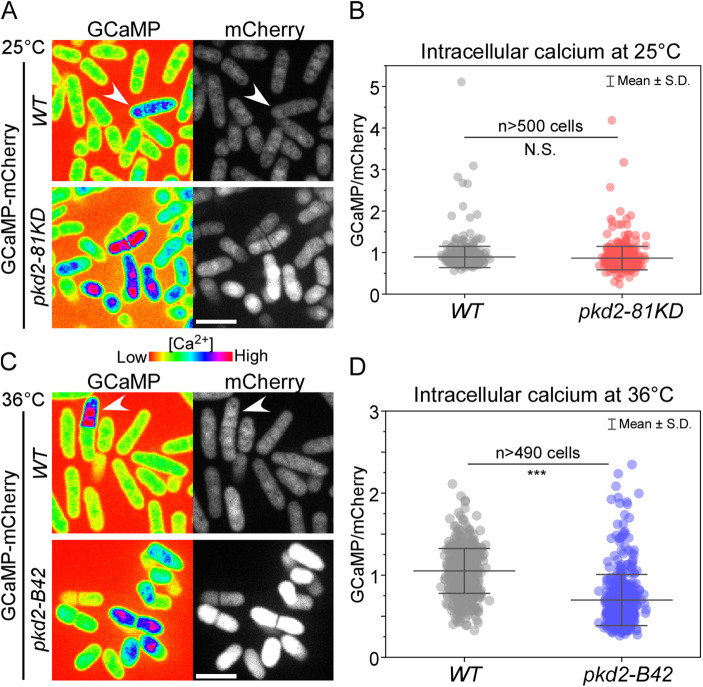
Intracellular calcium level was reduced in pkd2 mutant cells. The intracellular calcium level of wild type (WT) and pkd2 mutant cells at either the permissive temperature of 25°C, A and B, or the restrictive temperature of 36°C, C and D. (A, C) Representative fluorescence micrographs of wild type (top) and pkd2 mutant (bottom) cells expressing GCaMP-mCherry. Arrowhead: a cell with elevated calcium level. (B, D) Scatter interval plots of intracellular calcium level of the wild type and the pkd2 mutant cells. The average calcium level of pkd2-81KD cells was not significantly different from that of wild type cells (p > 0.05). In contrast, the average calcium level of pkd2-B42 cells was 34% lower than that of the wild type at 36°C. All data are pooled from three biological repeats. N.S.: no significant difference (p > 0.05), *** p < 0.001. Two-tailed Student’s t tests with unequal variance were used. Scale bars: 10 µm.

