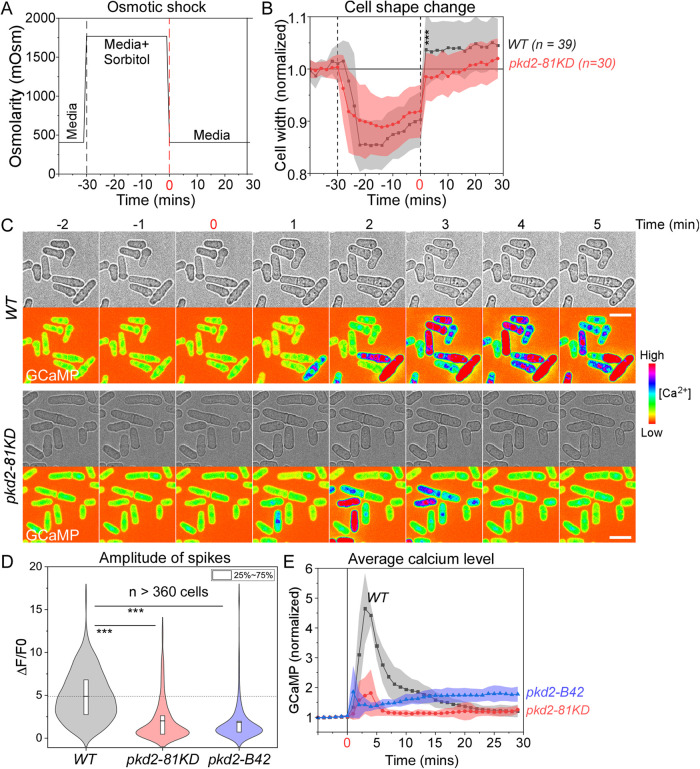
FIGURE 4:
Pkd2 mutations reduced calcium spikes triggered by hypoosmotic shock. (A) Time course of the osmolarity of the extracellular environment in the microfluidics chamber. Time zero: application of hypoosmotic shock through replacing EMM plus 1.2-M sorbitol with EMM media. (B) Time course of the cell width changes during the hypoosmotic shock. Cloud represents standard deviations. Both wild type (WT) and pkd2-81KD cells expanded their cell width significantly after shock, but the wild type expanded more than the pkd2-81KD mutant. (C) Time-lapse micrographs of wild type and pkd2-81KD cells expressing GCaMP. The hypoosmotic shock triggered calcium spikes. (D) Violin plot comparing calcium spikes amplitude of wild type, pkd2-81KD, and pkd2-B42 cells. (E) Time course of normalized GCaMP fluorescence during hypoosmotic shock. Cloud represents standard deviations. All data are pooled from at least three biological repeats. *** p < 0.001. Two-tailed Student’s t tests with unequal variance were used. Scale bars: 10 µm.

