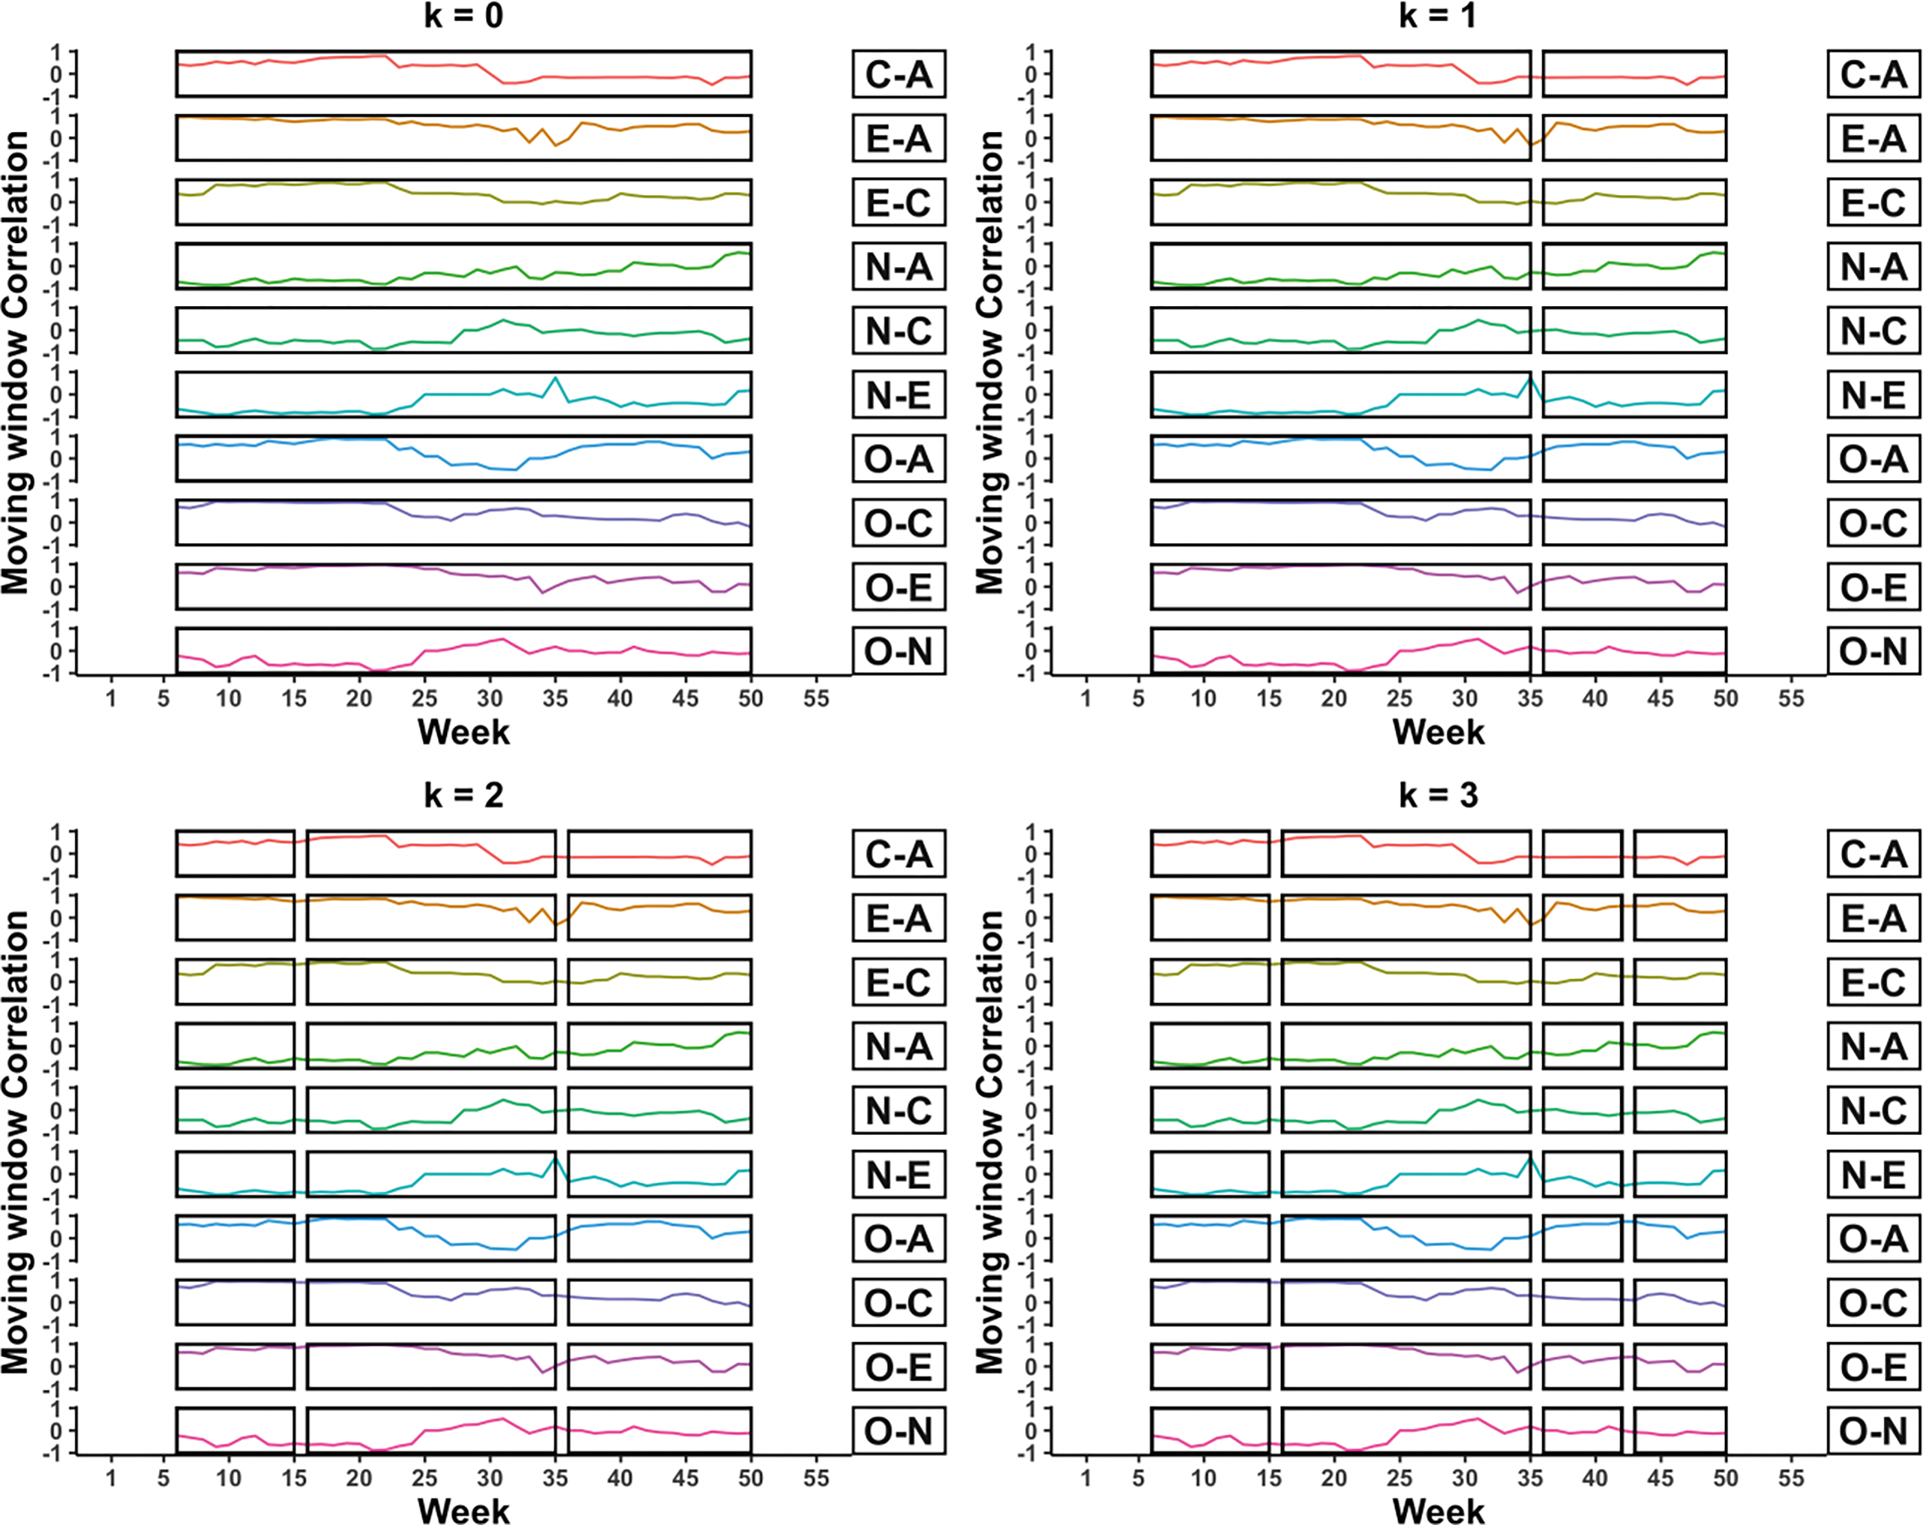
Figure 3.

Sample moving window correlation time series with 0 to 3 knots (i.e. 1 to 4 phases). Week is on the x-axis, moving window correlations (−1 to 1) are on the y-axis, and different rows indicate all unique combinations of traits. Boxes indicate each unique phase, meaning that knots occur at the breaks between boxes.
