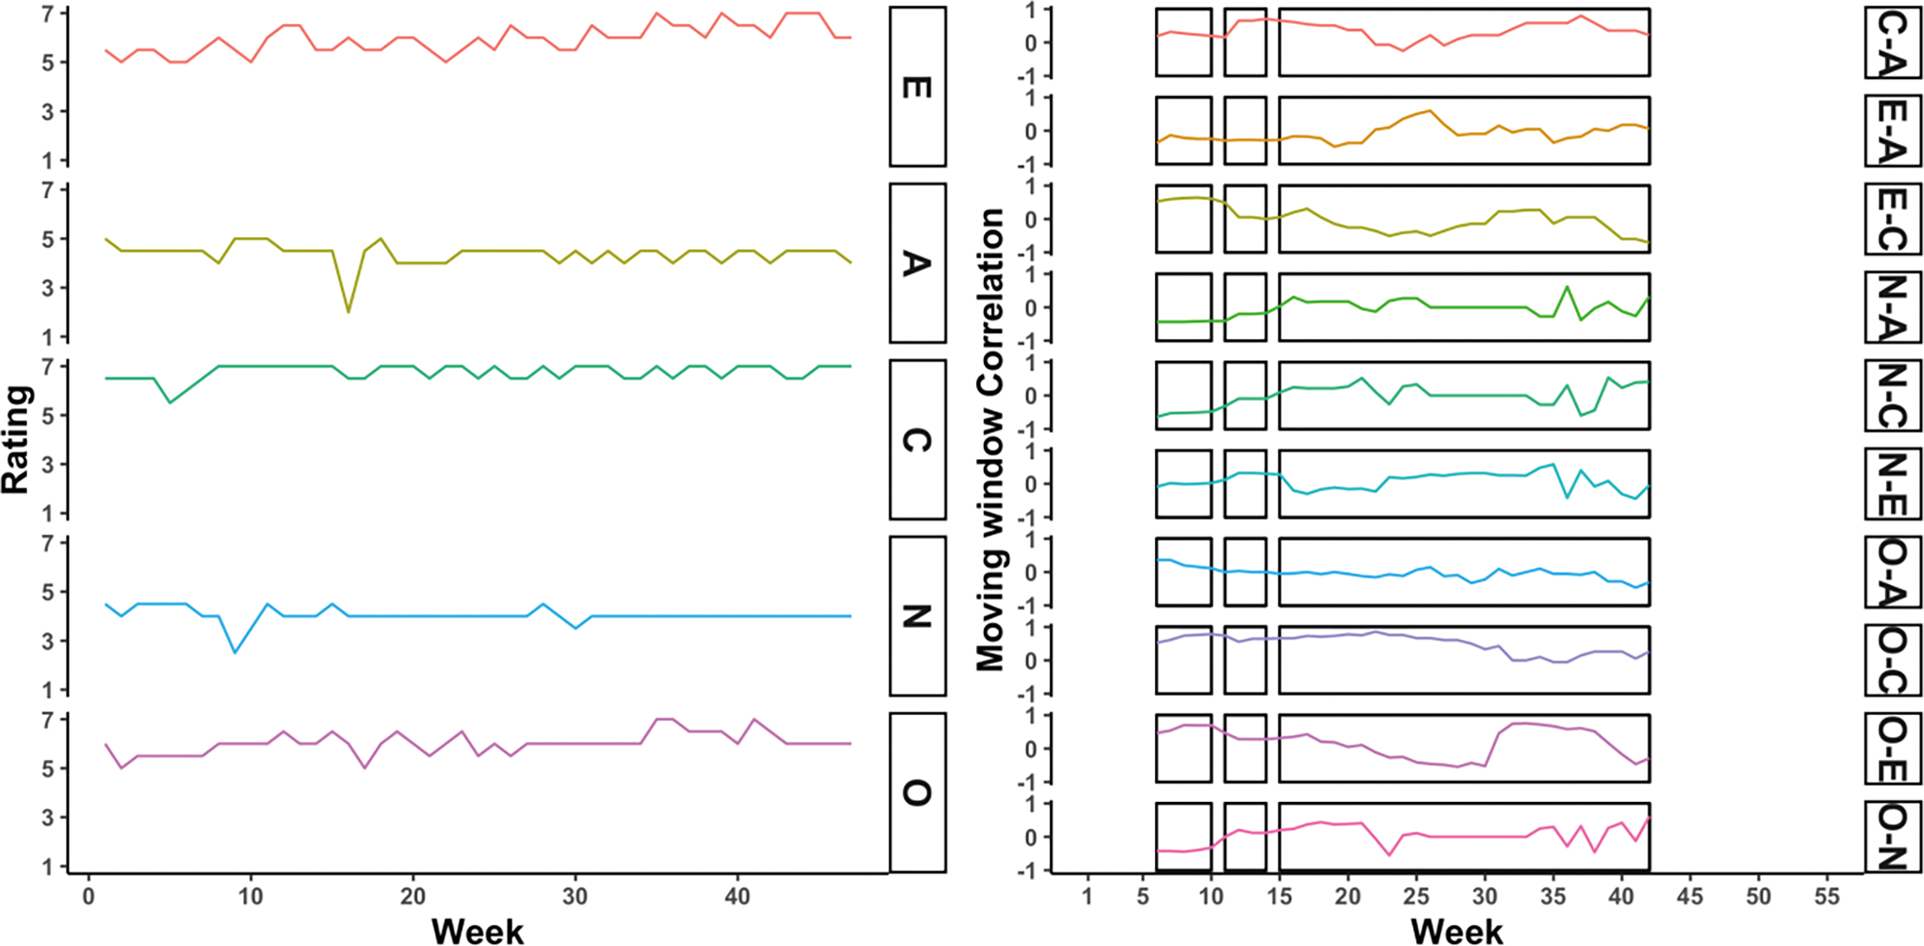
Figure 6.

Raw and moving window correlation time series for participant 087, who should one phase (no change points). The x-axis represents week in the study, the y-axis is the rating on a 1 to 7 scale in the left panel and a correlation (−1 to 1) in the right panel. Rows in the left panel capture trait composites, while rows in the right panel capture combinations of traits. E = Extraversion, A = Agreeableness, C = Conscientiousness, N = Neuroticism, and O = Openness.
