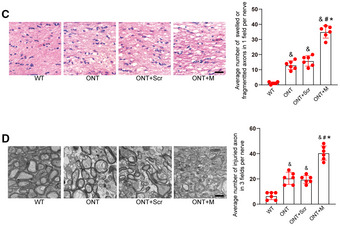
Figure 7. MALAT1 knockdown aggravates the injury of optic nerves.

-
CDegeneration of axons in the injured optic nerves was detected by hematoxylin and eosin (HE) staining. The photographs were taken at 40× magnification for each nerve (central portion of optic nerve). Data are presented as mean ± standard deviation (SD), n = 6 animals per group; scale bar, 20 μm; one‐way ANOVA followed by Dunnet's multiple comparison test; & P = 2.14 e‐6 (ONT vs. WT); & P = 1.29 e‐6 (ONT + Scr vs. WT); & P = 2.02 e‐9 (ONT + M vs. WT); # P = 4.83 e‐6 (ONT + M vs. ONT); P = 0.1553 (ONT + Scr vs. ONT); *P = 0.00023 (ONT + M vs. ONT + Scr).
-
DDegeneration of axons in the injured optic nerves was detected by electron microscopy. Three ultra‐thin cross sections per nerve were observed and added together to count the number of injured axons. Counting of injured axons was performed by three different investigators who were blinded to group identity and injury status. An average counting number of the three investigators was used for statistical analysis. Data are presented as mean ± SD, n = 6 animals per group; scale bar, 0.5 μm; one‐way ANOVA followed by Dunnet's multiple comparison test; & P = 0.00011 (ONT vs. WT); & P = 2.36 e‐5 (ONT + Scr vs. WT); & P = 1.24 e‐7 (ONT + M vs. WT); # P = 1.18 e‐5 (ONT + M vs. ONT); P = 0.6788 (ONT + Scr vs. ONT); *P = 0.00015 (ONT + M vs. ONT + Scr). The representative images of one replicate experiment and statistical results were shown.
Source data are available online for this figure.
