
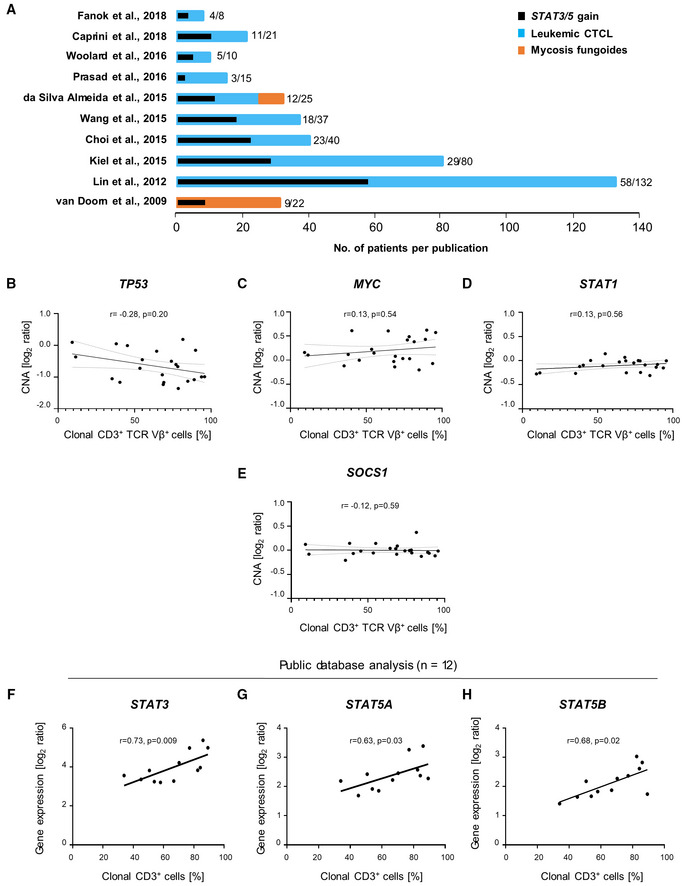
Figure EV1. STAT3/5 expression correlates with disease clonality.
-
AGraphical summary of the literature analysis on genomic CTCL studies performed in the last 10 years including larger cohorts of patients, as described in Table EV3. The number of patients carrying 17q gain, specifically of the region containing the STAT3/5 genes (17q11.2‐17q21.31) is written and depicted in black, in comparison to the total number of patients included and depicted in blue or orange. Blue color depicts Sezary syndrome patients, whereas orange depicts mycosis fungoides patients.
-
B–ESpearman correlation analysis using CNA log2 ratios and the percentage of clonal CD3+ cells detected in patients with (B) TP53, (C) MYC, (D) STAT1, and (E) SOCS1.
-
F–HSpearman correlation analysis on expression data extracted from the Oncomine™ Platform as published in Caprini et al (2009). Patients with 17q (STAT3/5) gains were selected and the percentage of clonal CD3+ cells was correlated with the respective STAT3/5 gene expression for the (F) STAT3_208991 reporter, (G) STAT5A_203010 reporter, and (H) STAT5B_212550 reporter.
Source data are available online for this figure.