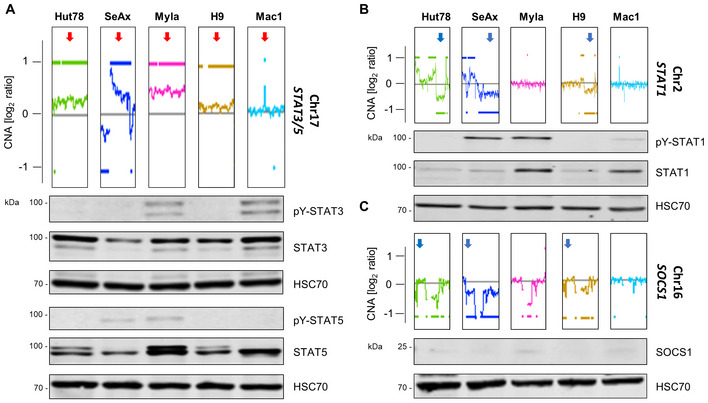
Figure 3. Established CTCL cell lines carrying STAT3/5 gains can be employed as patient‐like models for in vitro testing.

-
A–CGraphic depicts the aberration patterns on (A) chromosome 17 (STAT3/5), (B) chromosome 2 (STAT1), and (C) chromosome 16 (SOCS1) in the CTCL cell lines used in the study. Aberration patterns are represented as the log2 ratio of the fluorescence intensity of the tumor DNA vs. reference DNA and were generated by aCGH. The whole‐chromosome aberration patterns of the cell lines are shown in Appendix Fig S4. Immunoblotting for total protein STAT1/3/5 and activation levels: phospho‐Tyr (701)–STAT1/phospho‐Tyr (705)–STAT3/phospho‐Tyr (694/699)–STAT5 and SOCS1 protein levels. The cytokine‐dependent cell line, SeAx, was collected 30 min after 5 ng/ml IL‐2 and IL‐4 cytokine addition. HSC70 was used as loading control. One representative out of three independent experiments is shown.
Source data are available online for this figure.
