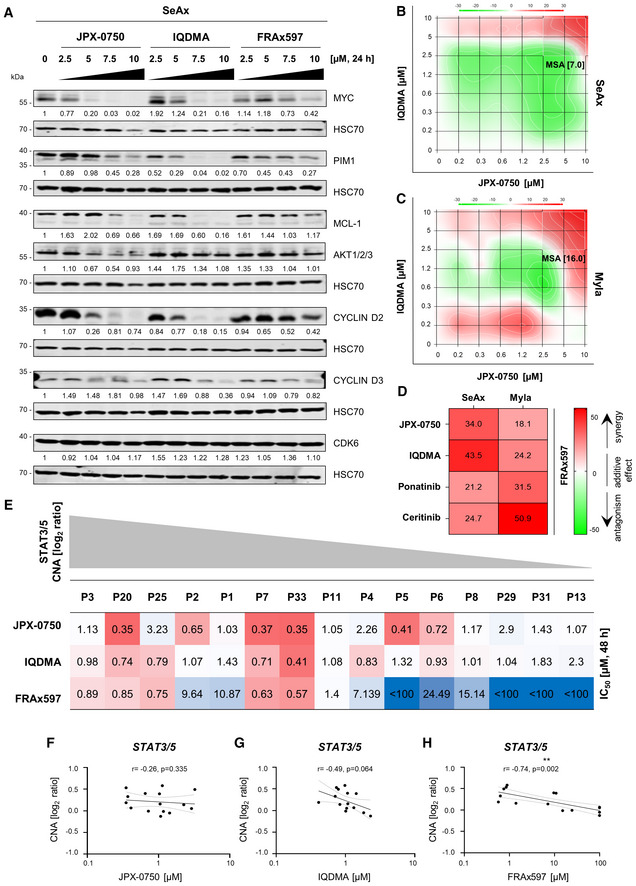
Figure 6. The PAK kinase inhibitor impacts downstream STAT3/5 signaling can be used in drug combinations and is highly specific for L‐CTCL cell carrying STAT3/5 gains.

-
AInhibitor treatment was carried out with increased dose escalation for 24 h. SeAx cells were collected 2 h after 7,5 ng/ml IL‐2 and IL‐4 cytokine addition. STAT3/5 target gene products MYC, PIM1, MCL‐1, and AKT1/2/3, as well as proteins regulating the cell cycle, such as CYCLIN D2 and D3, and CDK6, were probed by western blotting. HSC70 served as loading control. The normalized protein levels, quantified by densitometry, are shown below the respective blots. One representative out of three independent experiments is shown.
-
B–DSynergy analysis of the indicated two‐drug combinations in the SeAx and Myla cells after 48 h treatment. In each graph, the most synergistic area (MSA) is highlighted, which represents the most synergistic three‐by‐three dose window with the respective MSA score. The zero‐interaction potency model was applied to quantify the degree of synergy, according to which an MSA score below −10 indicates that drugs are antagonistic (green), a score between −10 and 10 indicates that two drugs are additive (white), while a score above 10 indicates a synergistic effect (red). (D) Heatmap showing MSA scores of the combination of FRAx597 with the listed drugs. One representative out of two independent experiments is shown. Synergy matrices for each drug combination are represented in Appendix Fig S5.
-
EHeatmap showing the IC50 values upon treatment of primary PBMCs isolated from L‐CTCL patients with JPX‐0750, IQDMA, and FRAx597. One experiment performed in triplicates using CellTiter‐Glo viability assays upon 48 h drug treatment is shown. The relative STAT3/5 log2 ratio value is depicted in gray.
-
F–HSpearman correlation analysis using CNA log2 ratios and the IC50 values for the respective drug.
Source data are available online for this figure.
