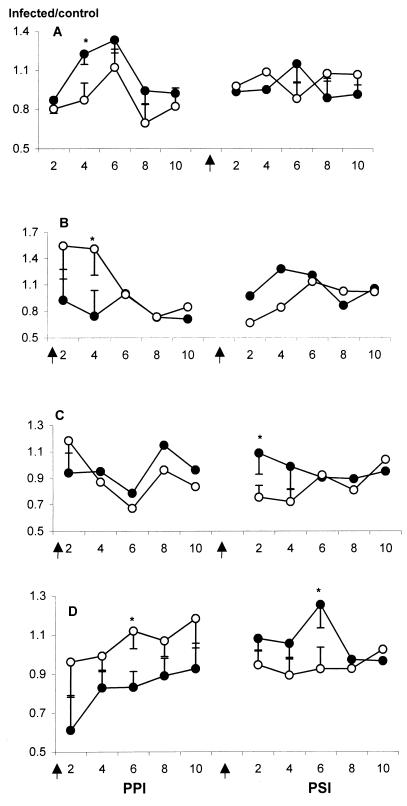
FIG. 3.
Kinetics of T-lymphocyte subpopulation changes in the cecal tonsils following E. tenella infection. SC (closed) and TK (opened) chickens were given a primary infection with 104 oocysts of E. tenella at day 0 and a secondary infection with 105 oocysts at day 21 ppi (arrow). Cecal tonsil lymphocytes (six chickens per group) were prepared at the indicated days ppi or psi, stained with MAbs detecting CD4 (A), CD8 (B), TCRγδ (C), or TCRαβ (D), and analyzed by a flow cytometry. The y axis indicates the ratios of T cells from infected to uninfected chickens; representative data from two independent studies are shown. ∗ indicates significant difference at P < 0.05.

