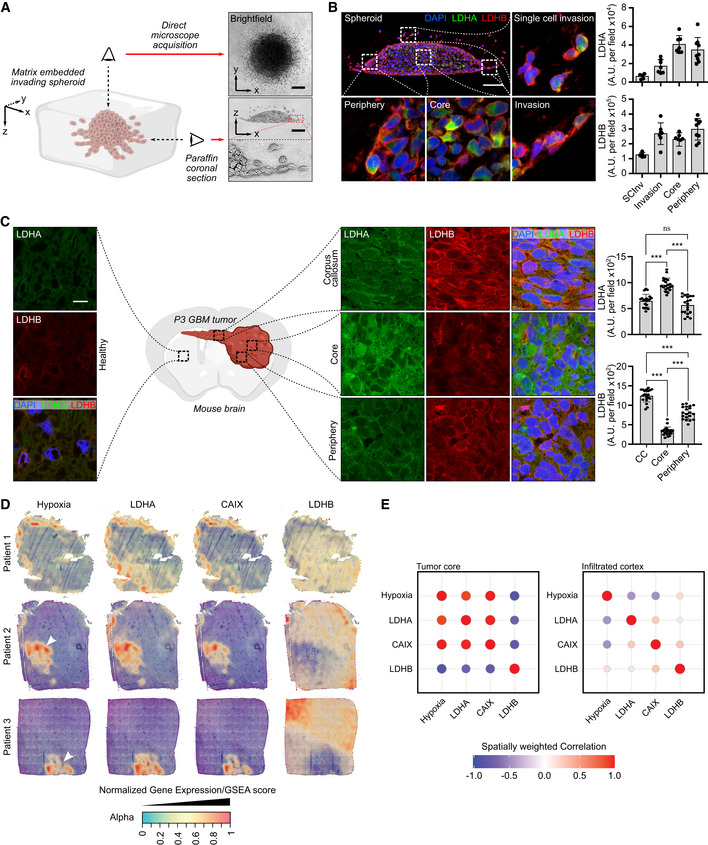
Figure 1. Regional expression of lactate dehydrogenases A and B in glioblastoma.

- Left, 3D representation of an invading P3 spheroid embedded in a collagen I matrix. Right, upper view: brightfield microscope image, lower view: coronal section of an invading spheroid. Scale bar: 100 μm.
- Coronal section of a P3 spheroid embedded with paraffin and stained with DAPI (blue), LDHA (green), and LDHB (red). Magnification boxes show different areas as depicted in the main image. Quantification of LDHA and LDHB staining was performed on the spheroid areas as indicated in the graphs. Scale bar: 100 μm. Data are represented as mean ± s.d. (5–8 fields per area of interest, one representative spheroid of three independent invading spheroids).
- Coronal section of P3 tumors in a mouse brain, embedded with paraffin and stained with DAPI (blue), LDHA (green), and LDHB (red). Magnification shows areas as depicted in the central illustration. Quantification of LDHA and LDHB staining was performed on the tumor areas as indicated in the graphs. Scale bar: 15 μm. Data are represented as mean ± s.d. (20 fields per area of interest, one representative brain of two independently implanted mouse brains) and analyzed using one‐way ANOVA followed by Tukey's multiple comparisons test. LDHA: CC vs. Core, P < 0.0001; CC vs. Periphery, P = 0.18; Core vs. Periphery, P < 0.0001. LDHB: CC vs. Core, P < 0.0001; CC vs. Periphery, P < 0.0001; Core vs. Periphery, P < 0.0001.
- Surface plots of the expression of LDHA, LDHB, CA9, and gene set enrichment for hypoxia, in various stRNA samples (patients 1–3). The transparency of the spots is indicative of the expression/enrichment for the genes, with an additional layer of color based on expression/enrichment.
- Spatially weighted correlation analysis of LDHA, LDHB, CAIX, and gene set enrichment for hypoxia, separated between the tumor core and the infiltrating areas.
Source data are available online for this figure.
