
Figure 2. Hypoxia‐driven lactate fuels the TCA cycle and drives cell invasion.
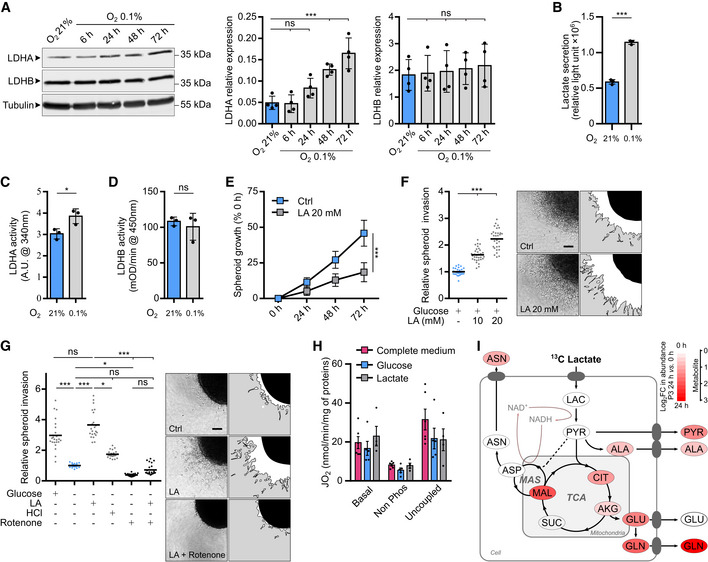
- Western blot analysis of LDHA and LDHB from P3 cells upon exposure to 21% or 0.1% O2 for 6, 24, 48, and 72 h. The graphs represent densitometry quantification of immunoblots normalized to tubulin (n = 4 independent experiments). Data are represented as mean ± s.d. and analyzed using one‐Way ANOVA following Dunnett's multiple comparisons tests. LDHA: O2 21% vs. O2 0.1% 6 h, P > 0.99; O2 21% vs. O2 0.1% 24 h, P = 0.15; O2 21% vs. O2 0.1% 48 h, P = 0.0009; O2 21% vs. O2 0.1% 72 h, P < 0.0001. LDHB: O2 21% vs. O2 0.1% 6 h, P > 0.99; O2 21% vs. O2 0.1% 24 h, P > 0.99; O2 21% vs. O2 0.1% 48 h, P = 0.97; O2 21% vs. O2 0.1% 72 h, P = 0.88.
- Lactate secretion of P3 cells exposed to 21 or 0.1% O2 was measured with a bioluminescent assay using a pro‐luciferin reductase substrate converted to luciferin in the presence of NADH (n = 3 independent experiments). Data are represented as mean ± s.d. and analyzed using unpaired t‐test: P < 0.0001.
- Enzymatic assays for the activity of LDHA in P3 cells (n = 3 independent experiments). Data are represented as mean ± s.d. and analyzed using unpaired t‐test: P = 0.03.
- Enzymatic assays for the activity of immune‐captured LDHB in P3 cells (n = 3 independent experiments). Data are represented as mean ± s.d. and analyzed using unpaired t‐test: P = 0.54.
- P3 spheroid growth was recorded over 72 h during incubation with or without 20 mM lactate. Area of spheroids was measured at 0, 24, 48, and 72 h, and growth is represented as a percentage of spheroid area compared to time 0 (n = 3 independent experiments, one experiment including 9–10 spheroids per condition). Data are represented as mean ± s.d., and growth at 72 h is analyzed using unpaired t‐test: P < 0.0001.
- P3 spheroid invasion in collagen I gel incubated 24 h at 21% O2 and incubated with 10 or 20 mM lactate (LA). Invasion rate is expressed as a fold change to the control (n = 4 independent experiments, one experiment including 6–8 spheroids per condition). Data are represented as mean and analyzed using Kruskal–Wallis test followed by Dunn's multiple comparisons test: Control vs. LA 10 mM, P < 0.0001; Control vs. LA 20 mM, P < 0.0001; LA 10 mM vs. LA 20 mM, P = 0.0009. Images of representative invasive spheroids in each condition. Scale bar: 100 μm.
- P3 spheroid invasion in collagen I gel incubated 24 h at 0.1% O2 and incubated with 20 mM lactate, 20 μM rotenone, and 1.5 mM HCl. Invasion rate is expressed as a fold change of the control (n = 4 independent experiments, one experiment including 6–8 spheroids per condition). Data are represented as mean and analyzed using Kruskal–Wallis test followed by Dunn's multiple comparisons tests: Control vs. Control + Glucose, P < 0.0001; Control vs. LA, P < 0.0001; Control vs. HCL, P = 0.11; Control vs. Rotenone, P = 0.01; Control vs. Rotenone + LA, P > 0.99; Control + Glucose vs. LA, P > 0.99; LA vs. HCL, P = 0.02; LA vs. Rotenone, P < 0.0001; LA vs. Rotenone + LA, P < 0.0001. Images of representative invasive spheroids in each condition. Scale bar: 100 μm.
- P3 cell mass‐specific respiration obtained by oxygraphy analysis. Cells were cultured in (i) complete medium or in medium without glucose and pyruvate supplemented with either (ii) 10 mM glucose or (iii) 20 mM lactate (n = at least four independent experiments). Data are represented as mean ± s.e.m. and analyzed using two‐way ANOVA followed by Tukey's multiple comparisons test (no statistical difference between conditions, P∈[0.6; 0.9999]). JO2 Basal: baseline mitochondrial respiration (oxygen consumption rate), JO2 non‐phosphorylating (non‐phos): minimal respiratory capacity, and JO2 uncoupled: maximal respiratory capacity.
- Metabolic changes of central carbon metabolism on P3 cells infused with [13C3] lactate for 24 h. Metabolites are labeled with a colored oval whose color corresponds to log2 fold changes between 24 h and 0 h (red, increase in 24 h) (n = 3 independent cell dishes). AKG, alpha‐ketoglutarate; ALA, alanine; ASN, asparagine; ASP, aspartate; CIT, citrate; GLN, glutamine; GLU, glutamate; LAC, lactate; MAL, malate; MAS, Malate–Aspartate Shuttle; PYR, pyruvate; SUC, succinate; TCA, TriCarboxylic Acid cycle. See also Appendix Figs S4 and S5.
Source data are available online for this figure.