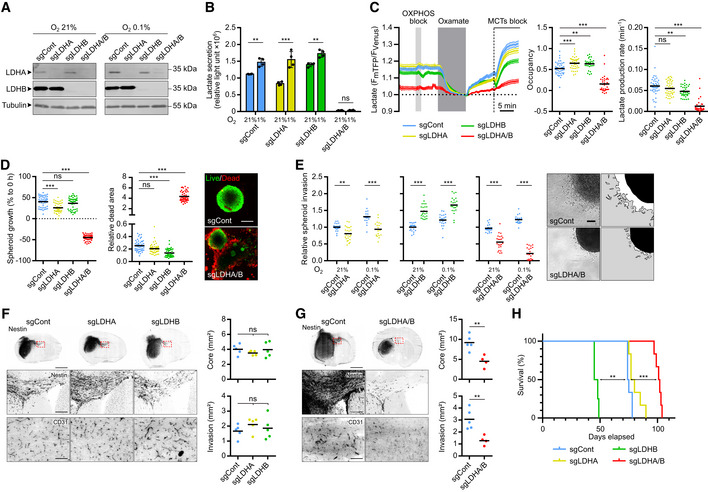
Figure 3. Double knockout of LDHA and LDHB impairs GB lactate metabolism, cell viability, and invasion.

-
AWestern blot analysis of LDHA and LDHB expression in P3 cells transduced with CRISPR‐Cas9 lentiviral vectors with scramble sequence (sgControl) or against LDHA (sgLDHA), LDHB (sgLDHB) or both (sgLDHA/B). Knockout (KO) cells were exposed to 21% or 1% O2 for 48 h.
-
BLactate secretion of P3 cells KO for LDHA, LDHB, or both, exposed to 21% or 1% (n = 4 independent experiments). Data are represented as mean ± s.d. and analyzed using two‐way ANOVA followed by Tukey's multiple comparisons test: sgCont 21% vs. sgCont 1%, P = 0.002; sgLDHA 21% vs. sgLDHA 1%, P < 0.0001; sgLDHB 21% vs. sgLDHB 1%, P = 0.004; sgLDHA/B 21% vs. sgLDHA/B 1%, P > 0.99; sgCont/sgLDHA/sgLDHB vs. sgLDHA/B, P < 0.0001.
-
CIntracellular lactate level analyzed with a fluorescent biosensor in P3 cells (control, KO for LDHA, LDHB, or both). Left, lactate level monitored in basal condition, followed by sequential exposure to OXPHOS block (5 mM sodium azide), 6 mM oxamate, and MCTs blockers (1 μM AR‐C1558585 + 1 mM diclofenac). The response to oxamate and MCTs blockers was used to determine, Middle, the basal lactate level (expressed as biosensor occupancy) and, Right, the lactate production rate (n = 4, 33–44 cells analyzed per condition). Data are represented as mean ± s.e.m. (Left) or as mean (Middle and Right) and analyzed using one‐way ANOVA following Tukey's multiple comparisons test. Occupancy: sgCont vs. sgLDHA, P = 0.001; sgCont vs. sgLDHB, P = 0.005; sgCont vs. sgLDHA/B, P < 0.0001. Lactate production: sgCont vs. sgLDHA, P = 0.32; sgCont vs. sgLDHB, P = 0.01; sgCont vs. sgLDHA/B, P < 0.0001. See Materials and Methods for analysis details and see also Fig EV3D.
-
DLeft: P3 spheroid growth recorded over 1 week at 1% O2 (n = 3 independent experiments, one experiment including 16 spheroids per condition). Data are represented as mean and analyzed using Kruskal–Wallis test followed by Dunn's multiple comparisons test. Spheroid growth: sgCont vs. sgLDHA, P = 0.0003; sgCont vs. sgLDHB, P = 0.78; sgCont vs. sgLDHA/B, P < 0.0001. Dead area: sgCont vs. sgLDHA, P = 0.19; sgCont vs. sgLDHB, P < 0.0001; sgCont vs. sgLDHA/B, P < 0.0001. Right: Viability of spheroids at 1 week, incubated with calcein (green) or ethidium homodimer‐1 (red). Scale bar: 200 μm.
-
EP3 spheroid invasion in collagen I gel, incubated 24 h at 21% or 0.1% O2. Invasion rate is expressed as fold change from controls (n = 4 independent experiments, one experiment including 6–8 spheroids per condition). Data are represented as mean and analyzed using two‐way ANOVA followed by Tukey's multiple comparisons test: sgCont 21% vs. sgLDHA 21%, P = 0.003; sgCont 0.1% vs. sgLDHA 0.1%, P < 0.0001; sgCont 21% vs. sgLDHB 21%, P < 0.0001; sgCont 0.1% vs. sgLDHB 0.1%, P < 0.0001; sgCont 21% vs. sgLDHA/B 21%, P < 0.0001; sgCont 0.1% vs. sgLDHA/B 0.1%, P < 0.0001. Images of representative of control or LDHA/B KO spheroids. Scale bar: 100 μm.
-
F, GA first cohort of mice was sacrificed when one mouse reached a limit point, brains were extracted, snap‐frozen in liquid nitrogen, sliced, and stained. For the second cohort, each mouse was sacrificed when it reached a limit point allowing the draw of survival curves. Left: Immunofluorescence staining of Nestin (top and middle) and CD31 (bottom) of control and LDHA/B KO P3 tumor section. Scale bars: 2 mm (top), 250 μm (middle) and 100 μm (bottom). Right: Graphs represent tumor core and invasion area of control and LDHA/B KO P3 tumors in mm2 (n = 5 mice per group, average of 5–6 sections per tumor). Data are represented as mean. For (F), data are analyzed using one‐way ANOVA followed by Dunnett's multiple comparisons test. Core: sgCont vs. sgLDHA, P = 0.48; sgCont vs. sgLDHB, P = 0.99. Invasion: sgCont vs. sgLDHA, P = 0.40; sgCont vs. sgLDHB, P = 0.81. For G, data are analyzed using unpaired t‐test. Core: sgCont vs. sgLDHA/B, P = 0.005. Invasion: sgCont vs. sgLDHA/B, P = 0.01.
-
HKaplan–Meier survival curves of xenotransplanted mice with P3 cells KO for LDHA (yellow), LDHB (green), LDHA/B (red), or control (blue) (n = 8 mice per group). Data are analyzed using Log‐rank (Mantel‐Cox) test: sgCont vs. sgLDHA, P = 0.06; sgCont vs. sgLDHB, P = 0.001; sgCont vs. sgLDHA/B, P = 0.0007.
Source data are available online for this figure.
