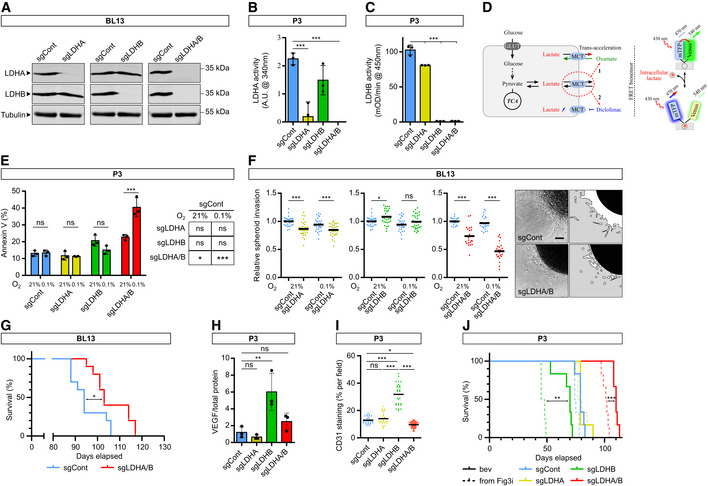
Western blot analysis of LDHA and LDHB from BL13 cells knockout by CRISPR‐Cas9 lentiviral vectors against LDHA, LDHB, or both, and upon exposure to 21% O2.
Enzymatic assays for the activity of LDHA in P3 cells (n = 3 independent experiments). Data are represented as mean ± s.d. and analyzed using one‐way ANOVA followed by Dunnett's multiple comparison test: sgCont vs. sgLDHA, P = 0.0005; sgCont vs. sgLDHB, P = 0.1; sgCont vs. sgLDHA/B, P < 0.0001.
Enzymatic assays for the activity of immune‐captured LDHB in P3 cells (n = 3 independent experiments). Data are represented as mean ± s.d. and analyzed using one‐way ANOVA followed by Dunnett's multiple comparison test: sgCont vs. sgLDHA, P = 0.0002; sgCont vs. sgLDHB, P < 0.0001; sgCont vs. sgLDHA/B, P < 0.0001.
Schematic representation of the intracellular lactate level monitoring with a fluorescent biosensor. The presence of the lactate changes the conformation of the biosensor and fluorescence emission. Known as an accelerated‐exchange transport (trans‐acceleration), oxamate was used to quickly release the lactate out of the cells for the determination of the lactate basal level. Then, diclofenac was used to block the lactate transporter for the quantification of the lactate production rate.
Cells incubated during 48 h at 21% or 0.1% O2, labeled with Annexin‐V FITC, and analyzed by cytometry (n = 3 independent experiments). Data are represented as mean ± s.d. and analyzed using two‐way ANOVA followed by Tukey's multiple comparison test: sgCont 21% vs. sgCont 0.1%, P > 0.99; sgLDHA 21% vs. sgLDHA 0.1%, P > 0.99; sgLDHB 21% vs. sgLDHB 0.1%, P = 0.3, sgLDHA/B 21% vs. sgLDHA/B 0.1%, P < 0.0001. Table of statistical comparisons of Annexin‐V signal in sgLDHA, sgLDHB and sgLDHA/B cells with respective control (either 21 or 0.1% O2): sgCont 21% vs. sgLDHA 21%, P > 0.99; sgCont 0.1% vs. sgLDHA 0.1%, P = 0.98; sgCont 21% vs. sgLDHB 21%, P = 0.07; sgCont 0.1% vs. sgLDHB 0.1%, P > 0.99; sgCont 21% vs. sgLDHA/B 21%, P = 0.01; sgCont 0.1% vs. sgLDHA/B 0.1%, P < 0.0001.
BL13 spheroid invasion in collagen I gel incubated 24 h at 21 or 0.1% O2. Invasion rate is expressed as a fold change of the control (n = 4 independent experiments, one experiment including 7–8 spheroids per condition). Data are represented as mean and analyzed using two‐way ANOVA test followed by Tukey's multiple comparison test: sgCont 21% vs. sgLDHA 21%, P < 0.0001; sgCont 0.1% vs. sgLDHA 0.1%, P = 0.001; sgCont 21% vs. sgLDHB 21%, P = 0.03; sgCont 0.1% vs. sgLDHB 0.1%, P = 0.29; sgCont 21% vs. sgLDHA/B 21%, P < 0.0001; sgCont 0.1% vs. sgLDHA/B 0.1%, P < 0.0001. Images of representative invasive sgControl or sgLDHA/B spheroids. Scale bar: 100 μm.
Kaplan–Meier survival curves of xenotransplanted mice with BL13 cells KO for LDHA/B (red) or control (blue) (n = 10 mice per group). Data are analyzed using log‐rank (Mantel‐Cox) test: P = 0.02.
Supernatants were collected from each cell line and analyzed by using ELISA to detect VEGF (n = 3 independent experiments). Data are represented as mean ± s.d. and analyzed using one‐way ANOVA followed by Dunnett's multiple comparison test: sgCont vs. sgLDHA, P = 0.91; sgCont vs. sgLDHB, P = 0.004; sgCont vs. sgLDHA/B, P = 0.5.
Tumor blood vessels were stained with anti‐CD31 antibodies and CD31 staining area was calculated over tumor area (related to Figs
3F and G). Data are represented as mean and analyzed using one‐way ANOVA followed by Tukey's multiple comparison test: sgCont vs. sgLDHA,
P = 0.81; sgCont vs. sgLDHB,
P < 0.0001; sgCont vs. sgLDHA/B,
P = 0.034; sgLDHA vs. sgLDHB,
P < 0.0001; sgLDHB vs. sgLDHA/B, < 0.0001.
Kaplan–Meier survival curves complement of Fig
3H where xenotransplanted mice with LDHA/B KO P3 spheroids were treated by bevacizumab (
n = 8 mice per group). Data are analyzed using log‐rank (Mantel‐Cox) test: sgLDHB vs. sgLDHB + bevacizumab,
P = 0.001; sgLDHA/B vs. sgLDHA/B + bevacizumab,
P = 0.0005.

