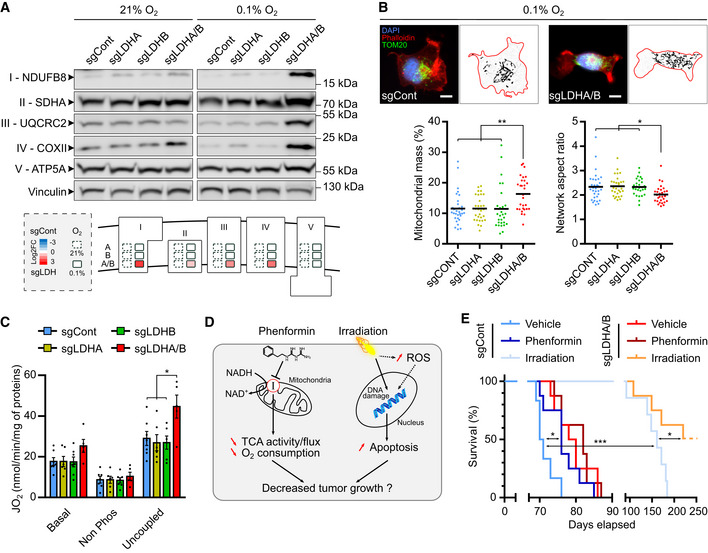
Figure 5. LDHA/B knockout remodels mitochondrial functions and sensitizes tumors to radiation.

- Western blot analysis of mitochondrial respiratory chain subunits from LDH KO P3 cells upon exposure to 21% or 0.1% O2. Roman numbers indicate the respiratory complex number. The diagram below represents densitometry quantification of the immunoblots normalized to vinculin and expressed as log2 foldchange to control cells in 21% and 0.1% O2 (n = 3 independent experiments).
- Epifluorescence (top) and quantitative image analysis (bottom) of immune‐stained mitochondria (TOM20, green) from LDH KO P3 cells (Phalloidin, red; DAPI, blue) upon exposure to 0.1% O2 (n = 2 independent experiments, 28–32 cells per group). Data are represented as mean and analyzed using one‐way ANOVA followed by Tukey's multiple comparisons test. Mitochondrial mass: sgCont vs. sgLDHA/B, P = 0.005; sgLDHA/sgLDHB vs. sgLDHA/B, P = 0.006. Network aspect ratio: sgCont vs. sgLDHA/B, P = 0.03; sgLDHA vs. sgLDHA/B, P = 0.02; sgLDHB vs. sgLDHA/B, P = 0.04. Mitochondrial mass corresponds to the area covered by the mitochondria relative to the entire cell area. Network aspect ratio is the ratio of the major axis to minor axis of the mitochondrial network. Scale bar: 10 μm.
- LDH KO P3 cell mass‐specific respiration obtained by oxygraphy analysis (n = 4 independent experiments). Data are represented as mean ± s.e.m. and analyzed using two‐way ANOVA followed by Tukey's multiple comparisons test: sgCont vs. sgLDHA/B, P = 0.015; sgLDHA/sgLDHB vs. sgLDHA/B, P = 0.005. For details, see Fig 2H.
- Schematic representation of phenformin or irradiation effects on tumor cells.
- Kaplan–Meier survival curves of xenotransplanted mice with LDHA/B KO (red) or control (blue) P3 cells, treated with phenformin or irradiated with 10 Gy (n = 6–8 mice per group). Data are analyzed using Log‐rank (Mantel‐Cox) test: sgCont Vehicle vs. sgCont Phenformin, P = 0.019; sgCont Vehicle vs. sgCont Irradiation, P = 0.0002; sgCont Irradiation vs. sgLDHA/B Irradiation, P = 0.024.
Source data are available online for this figure.
