
Figure 6. An antiepileptic drug reduces GB growth and invasion.
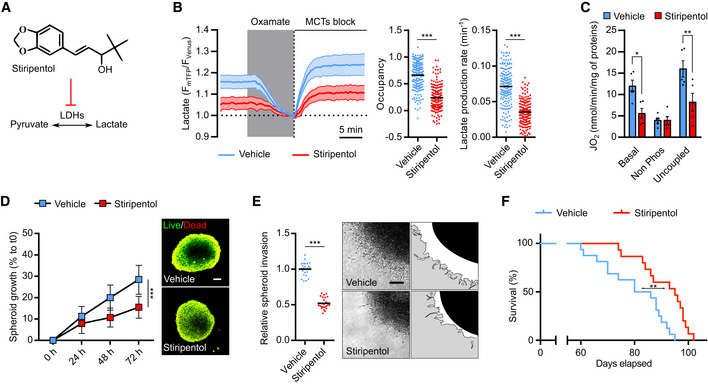
- Stiripentol, an aromatic allylic alcohol drug that inhibits LDH.
- Intracellular lactate level was analyzed with a fluorescent biosensor in P3 cells treated with vehicle or 500 μM stiripentol. Left, lactate level monitored in basal condition, followed by sequential exposure to 6 mM oxamate and MCTs block (1 μM AR‐C1558585 + 1 mM diclofenac). The response to oxamate and MCTs block was used to determine, Middle, the basal lactate level (expressed as biosensor occupancy) and, Right, the lactate production rate (n = 4, 33–45 cells analyzed per condition). Data are represented as mean ± s.e.m. (Left) or as mean (Middle and Right) and analyzed using unpaired t‐test (Occupancy) and Mann–Whitney test (Lactate production). For both analyses, P < 0.0001.
- P3 cell mass‐specific respiration in cells treated with 500 μM stiripentol, obtained by high‐resolution oxygraphy analysis (n = 5 independent experiment). Data are represented as mean ± s.d. and analyzed using two‐way ANOVA followed by Sidak's multiple comparisons test: Basal, P = 0.013; Non‐Phos, P > 0.99; Uncoupled, P = 0.003 For details, see Fig 2H.
- Left: P3 spheroid growth recorded over 72 h during incubation with stiripentol at 0.1% O2 (n = 3 independent experiments, one experiment including eight spheroids per condition). Data are represented as mean ± s.d., and growth at 72 h is analyzed using unpaired t‐test: P < 0.0001. Right: Viability of spheroids at 72 h, incubated with calcein (green) or ethidium homodimer‐1 (red). Scale bar: 100 μm.
- Left: P3 spheroid invasion in collagen I gel, incubated 24 h with 500 μM stiripentol at 0.1% O2. Invasion rate is expressed as fold change from control (n = 3 independent experiments, one experiment including eight spheroids per condition). Data are represented as mean and analyzed using unpaired t‐test: P < 0.0001. Right: Representative images of invasive spheroids for each condition. Scale bar: 100 μm.
- Kaplan–Meier survival curves of xenotransplanted mice with P3 cells. Mice were treated either with vehicle (blue) or stiripentol at 150 mg/kg (red) (n = 15–16 mice per group). Data are analyzed using Log‐rank (Mantel‐Cox) test: P = 0.002.
Source data are available online for this figure.