
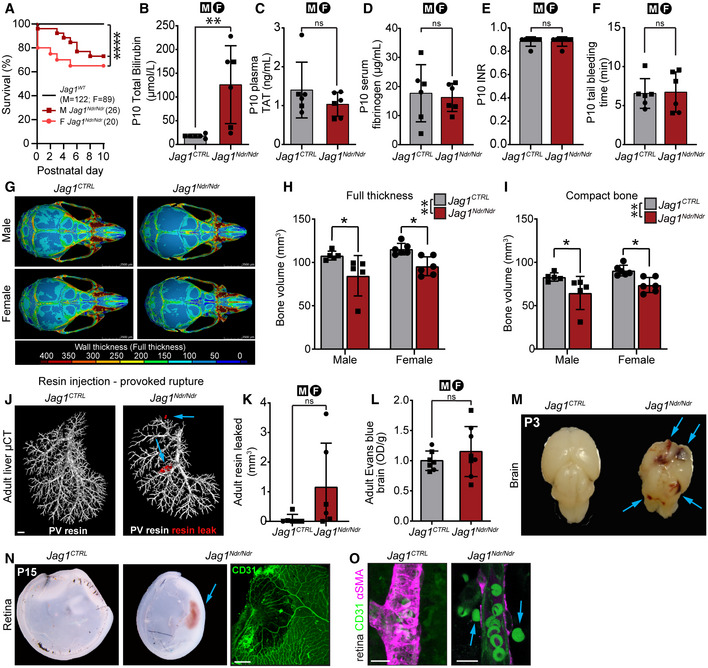
Figure 2. Cholestatic Jag1 Ndr/Ndr mice exhibit normal coagulation but a thinner skull and sporadic spontaneous and provoked hemorrhages.
-
APup survival analysis between P0 and P10, by sex. Each dot represents the absolute percent of remaining animals per group (Jag1 CTRL n = 211, male Jag1 Ndr/Ndr n = 26, female Jag1 Ndr/Ndr n = 20, log‐rank test, ****P < 0.0001).
-
BP10 plasma total bilirubin levels (n = 6 per group, unpaired t‐test, **P = 0.0091).
-
CP10 plasma thrombin antithrombin levels (n = 6 per group, unpaired t‐test, ns, P = 0.2788).
-
DP10 serum fibrinogen levels (n = 6 per group, unpaired t‐test, ns, P = 0.7585).
-
EP10 whole blood prothrombin time (INR; n = 6 per group, unpaired t‐test, ns, P > 0.9999).
-
FP10 tail bleeding time (n = 6 per group, unpaired t‐test, ns, P = 0.8916).
-
G–IμCT of P30 skulls. (G) Color map depicting wall thickness. Scale bar 3.5 mm. (H) Skull full thickness volume (n = 5‐6 per group, two‐way ANOVA. Interaction P = 0.7595; Sex P = 0.1164, Genotype **P = 0.0012. Šídák's multiple comparisons test: Male Jag1 +/+ vs Jag1 Ndr/Ndr *P = 0.0227; Female Jag1 +/+ vs Jag1 Ndr/Ndr * P = 0.034), (I) Compact bone total volume (n = 5‐6 per group, two‐way ANOVA. Interaction P = 0.8631; Sex P = 0.0901, Genotype **P = 0.0014. Šídák's multiple comparisons test: Male Jag1 +/+ vs Jag1 Ndr/Ndr *P = 0.0305; Female Jag1 +/+ vs Jag1 Ndr/Ndr *P = 0.0307).
-
J, K(J) Provoked vascular accidents induced by portal vein resin injection, with (K) resin leakage quantification outside of blood vessels (red) in adult mice (n = 6 per group, unpaired t‐test, ns, P = 0.1088). Scale bar 1 mm.
-
LAdult brain Evans blue assay (Jag1 CTRL n = 7, Jag1 Ndr/Ndr n = 8, unpaired t‐test, ns, P = 0.3807).
-
MHemorrhagic P3 Jag1 Ndr/Ndr brain (n = 2/83 Jag1 Ndr/Ndr mice, sex n.d.).
-
NHemorrhagic P15 Jag1 Ndr/Ndr retina. Scale bar 20 μm. Sex n.d.
-
ORed blood cells (green outside P10 Jag1 Ndr/Ndr retinal arteriole. Scale bar 10 μm.
Data information: Bar graphs depict mean values ± standard deviation, each dot represents one biological replicate. Circles represent females, squares represent males. For details/results of statistical analyses, please see source data. μCT, micro computed tomography; n.d., not determined; OD, optical density; TAT, thrombin antithrombin; P(X), postnatal day X.
Source data are available online for this figure.