
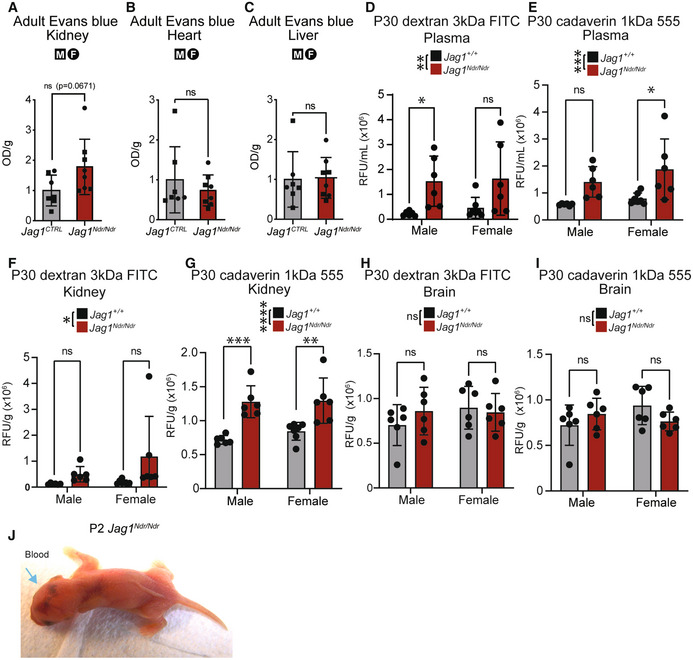
Figure EV2. Jag1 Ndr/Ndr mice exhibit selective renal vascular permeability.
-
A–CRelative vascular leakage as assessed by Evans blue extracted from adult (A) kidney (P = 0.0671, ns), (B) heart (P = 0.4316, ns), and (C) liver (P = 0.8988, ns) of Jag1 CTRL and Jag1 Ndr/Ndr adult mice (n = 7‐8 per group, Unpaired t‐test).
-
D, ERelative fluorescence in P30 plasma (D) of 3 kDa Dextran FITC (Two‐way ANOVA on biological replicates/individual mice, followed by Šídák's multiple comparison test; Interaction P = 0.08663, Sex P = 0.6541, Genotype **P = 0.0025) or (E) 1 kDa Cadaverin 555 (Two‐way ANOVA on biological replicates/individual mice followed by Šídák's multiple comparison test; Interaction P = 0.625, Sex P = 0.186, Genotype ***P = 0.0009).
-
F, GRelative vascular permeability in P30 kidney assessed by relative fluorescence of (F) 3 kDa Dextran FITC (Two‐way ANOVA on biological replicates/individual mice, followed by Šídák's multiple comparison test; Interaction P = 0.3296, Sex P = 0.2374, Genotype *P = 0.0384) (G) or 1 kDa Cadaverin 555 (Two‐way ANOVA on biological replicates/individual mice, followed by Šídák's multiple comparison test; Interaction P = 0.5308, Sex P = 0.4112, Genotype ****P < 0.0001).
-
H, IRelative vascular permeability in P30 brain assessed by relative fluorescence of (H) 3 kDa Dextran FITC (Two‐way ANOVA on biological replicates/individual mice, followed by Šídák's multiple comparison test; Interaction P = 0.2942, Sex P = 0.3624, Genotype P = 0.591) or (I) 1 kDa Cadaverin 555 (Two‐way ANOVA on biological replicates/individual mice, followed by Šídák's multiple comparison test; Interaction P = 0.0596, Sex P = 0.3806, Genotype P = 0.7301).
-
JHemorrhages in brain and body of one Jag1 Ndr/Ndr pup at P2, corresponding to brain data in Fig 2M, brain dissected out the next day at P3
Data information: Bar graphs depict mean values ± standard deviation, each dot represents one biological replicate. Circles represent females, squares represent males (A‐C). For details/results of statistical analyses, please see source data.
Source data are available online for this figure.