
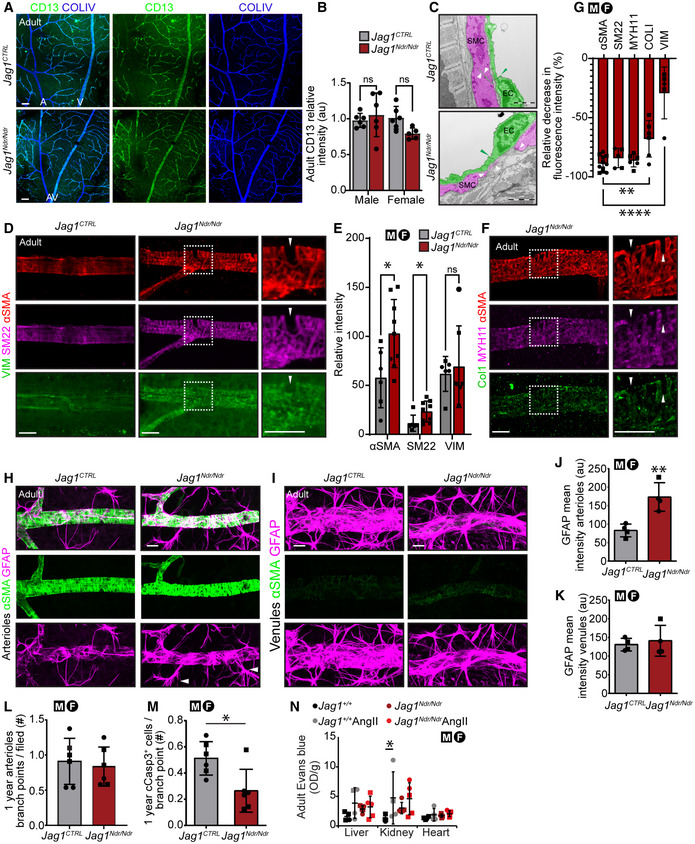
Figure EV4. Jag1 Ndr/Ndr mice display CADASIL‐like sparse vascular smooth muscle cell coverage of arteries with an increase in artery‐associated reactive astrocytes.
-
A, B(A) CD13 pericyte coverage of blood vessels was not reduced in adult Jag1 Ndr/Ndr mice. Scale bars 20 μm. (B) Quantification of CD13 intensity per field (n = 5‐6 per group, Two‐way ANOVA followed by Šídák's multiple comparison test, Interaction P = 0.0737, Sex P = 0.1642, Genotype P = 0.3706).
-
CTransmission electron microscopy of coronary arteries of adult mice. Vascular smooth muscle cells (SMC) are pseudo‐colored in magenta and endothelial cells (ECs) in green. White arrowheads label SMC edges and the distances between SMCs. Green arrowhead marks the tight junctions. Scale bars 2 μm.
-
D, E(D) Staining for contractile (αSMA, SM22) and synthetic (VIM) vascular SMC (E) with quantification (n = 6–9 per group, Multiple unpaired t‐tests, αSMA *P = 0.0214, SM22 *P = 0.0302, VIM P = 0.6801). Boxed region indicates region with αSMA‐negative gap (labeled by white arrowhead). Scale bar 20 μm.
-
F, G(F) Staining for contractile (αSMA, MYH11) and synthetic (COLI) vascular SMC. Boxed region indicates region with αSMA‐negative gap (labeled by white arrowhead). Scale bar 20 μm. (G) Relative decrease in fluorescence intensity of different vascular SMC markers within gap compared to within vascular SMC (set to 100%), (n = 5‐11 per group, one‐way ANOVA P < 0.0001, followed by Dunnett's multiple comparisons test: ASMA vs. COLI Adjusted **P = 0.0066, ASMA vs. VIM adjusted ****P < 0.0001).
-
H–K(H) GFAP+ astrocytes are more prevalent around adult Jag1 Ndr/Ndr arterioles (I) but not veins. White arrowheads label reactive astrocytes. Scale bars 20 μm. (J, K) Quantification of mean GFAP intensity on retinal (J) arterioles (n = 4, unpaired t‐test, **P = 0.0052), (K) venules (n = 4, unpaired t‐test, P = 0.6547).
-
L, M(L) Number of arteriolar first‐generation branch points in 1‐year‐old mice (n = 6, unpaired t‐test, P = 0.6823). (M) Number of cCasp3+ cells associated with first‐generation arteriolar branching point (n = 6, unpaired t‐test, *P = 0.0153).
-
NEvans blue extracted from liver, kidney, and heart of mice treated with PBS or Angiotensin II (n = 4‐5 per group, two‐way ANOVA with Subject matching. Interaction P = 0.2576, Organ P = 0.0011, Genotype & Treatment P = 0.2086 Subject ***P = 0.0004, followed by Tukey's multiple comparison test, Jag1 +/+ vs. Jag1 +/+ AngII *P < 0.05).
Data information: Bar graphs depict mean values ± standard deviation, each dot represents one biological replicate. Circles represent females, squares represent males. For details/results of statistical analyses, please see source data. A, arteriole; AngII, Angiotensin II; EC, endothelial cell; SMC, smooth muscle cell; V, venule.
Source data are available online for this figure.