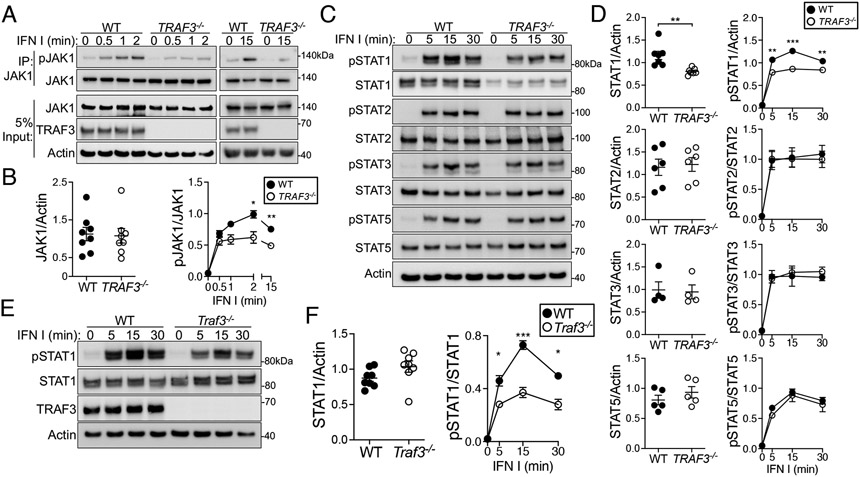
Fig. 1. Effect of TRAF3 deficiency upon early IFNAR-mediated signaling in T cells.
(A to C) WT and TRAF3−/− HuT28 human T cells were treated with type I IFN (1000 U/ml) for the indicated times. (A) JAK1 was immunoprecipitated from cell lysates and its activation (as assessed by detection of phosphorylation at Tyr1034/1035) was analyzed by Western blotting. (B) Quantification of the relative amounts of total and phosphorylated JAK1 from four biological replicates. (C) Representative Western blotting analysis of the phosphorylation and activation of STAT1 (pTyr701), STAT2 (pTyr690), STAT3 (pTyr705), and STAT5 (pTyr694). (D) Quantification of the relative amounts of the indicated total and phosphorylated STAT proteins from six biological replicates. (E and F) Mouse CD4+ T cells were treated with type I IFN (1000 U/ml) for the indicated times. (E) Representative Western blotting analysis of STAT1 activation (pTyr701). (F) Quantification of the relative amounts of total and phosphorylated STAT1 from seven biological replicates; n = 7 mice per group. Blots are representative of four (A), six (B), and seven (E) independent experiments with similar results. *P < 0.05, **P < 0.01, ***P < 0.001 by unpaired t test (for basal total protein) or two-way ANOVA with Sidak’s multiple comparisons test (for time courses). Error bars represent the SEM.

