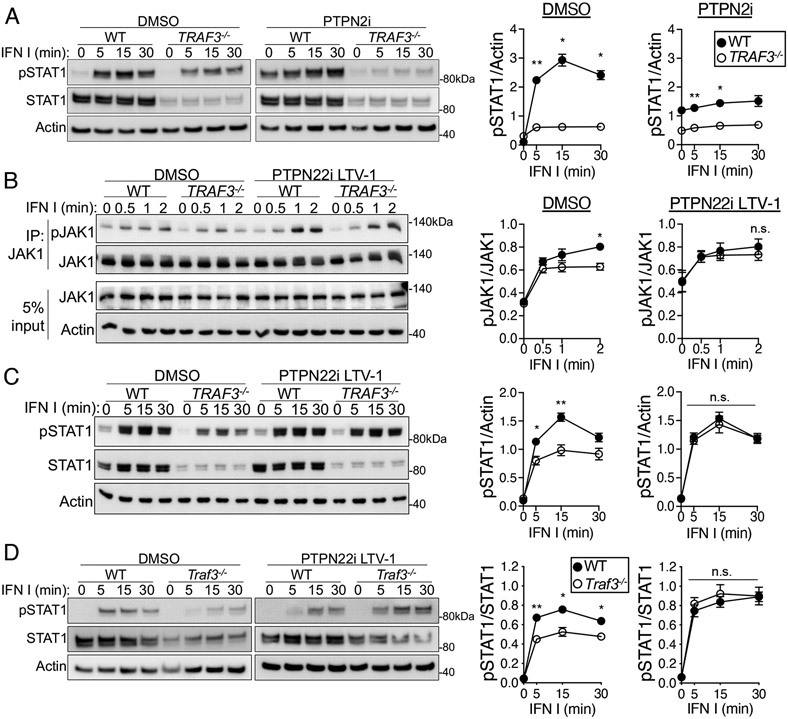
Fig. 4. Role of PTPN22 in the regulation of IFNAR signaling by TRAF3 in T cells.
(A to C) WT and TRAF3-deficient HuT28 human T cells were pretreated with a PTPN22 inhibitor (PTPN22i, 10 μM LTV-1), a PTPN2 inhibitor (PTPN2i, 1 nM SF-1670), or an equivalent concentration of DMSO and then were stimulated with type I IFN (1000 U/ml) for the indicated times in the presence of inhibitor or DMSO. (A) Representative Western blotting analysis of pSTAT1 Tyr701 (left) and quantification of the relative amounts of pSTAT1 from four biological replicates (right). (B) Representative Western blotting analysis of pJAK1 Tyr1034/1035 (left) and quantification of the relative amounts of pJAK1 from five biological replicates (right). (C) Representative Western blotting analysis of pSTAT1 Tyr701 (left) and quantification of the relative amounts of pSTAT1 from four biological replicates (right). (D) Representative Western blotting analysis of pSTAT1 Tyr701 in mouse CD4+ T cells (left) that were treated as described in (A) with PTPN22i and type I IFN (left) and quantification of the relative amounts of pSTAT1 from four biological replicates (right), with n = 4 mice per group. Graphs include replicates from four (C and D) and five (B) independent experiments. *P < 0.05, **P < 0.01, ***P < 0.001, ****P < 0.0001 by two-way ANOVA with Sidak’s multiple comparisons test. Error bars represent the SEM.

