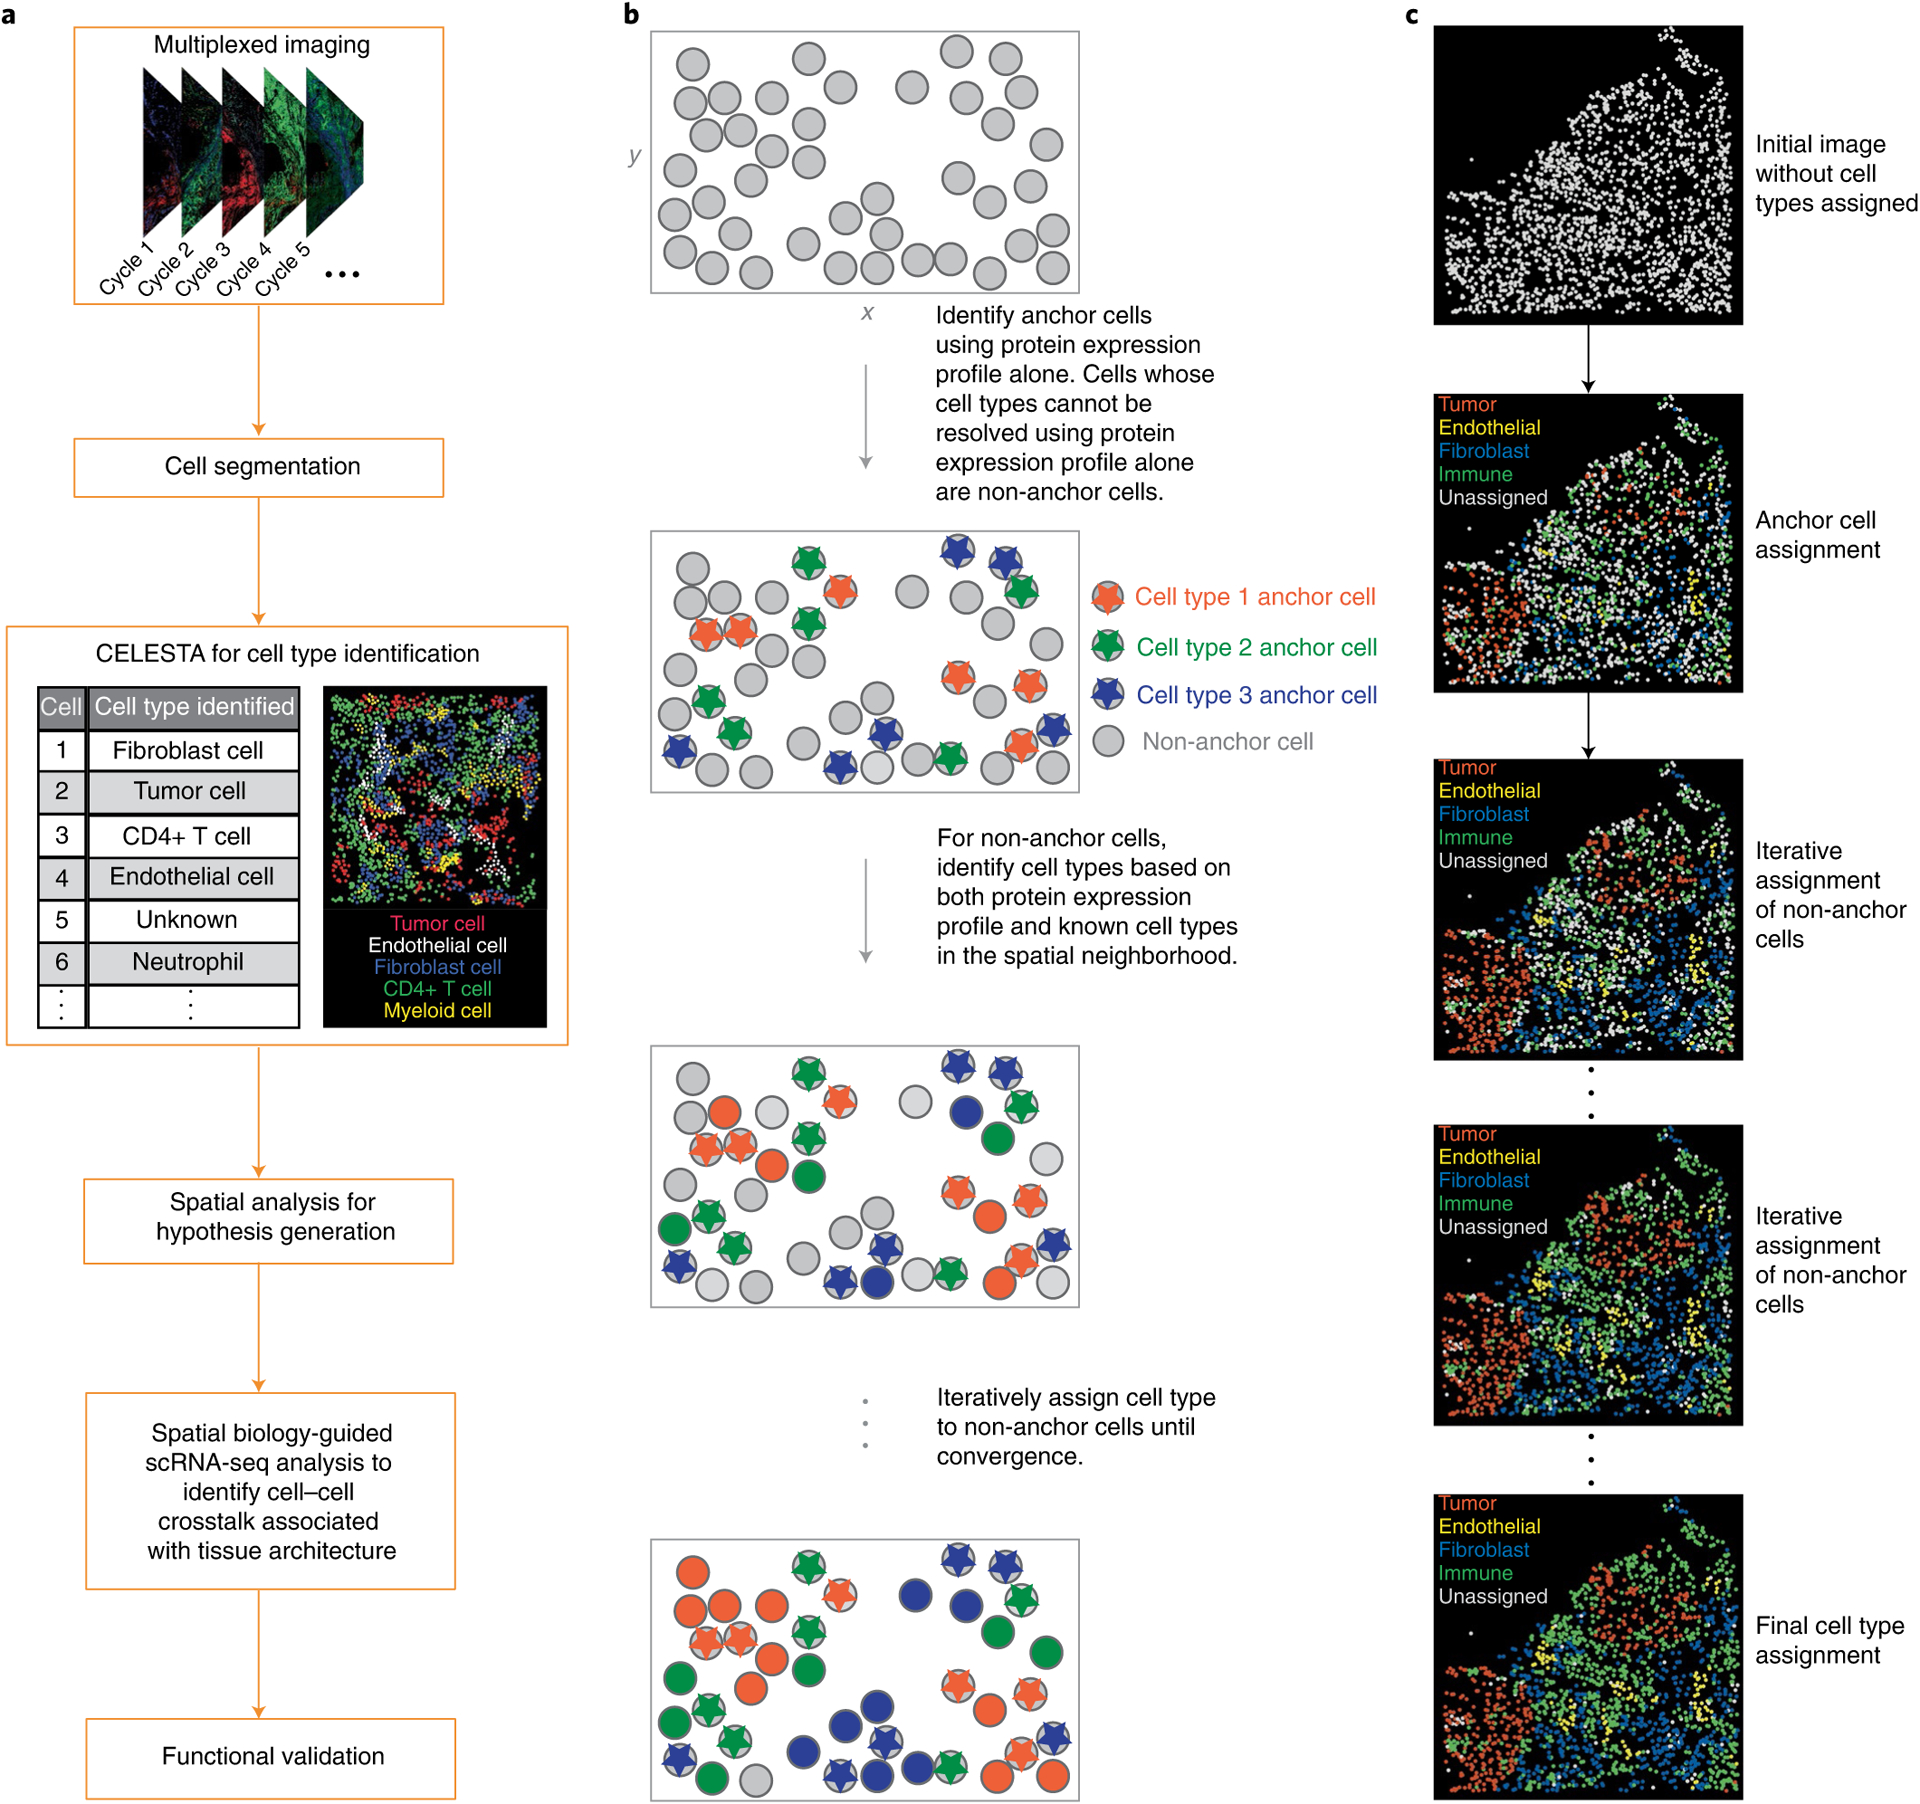
Fig. 1 |. Image analysis pipeline with CELESTA.

a, Typical analysis pipeline for multiplexed in situ image data. b, Schematic diagram illustrating the iterative process in CELESTA’s cell type assignment. c, In CELESTA’s cell type assignment, the cell types are assigned to an image tile in which each dot represents a single cell and is positioned on the cell’s centroid.
