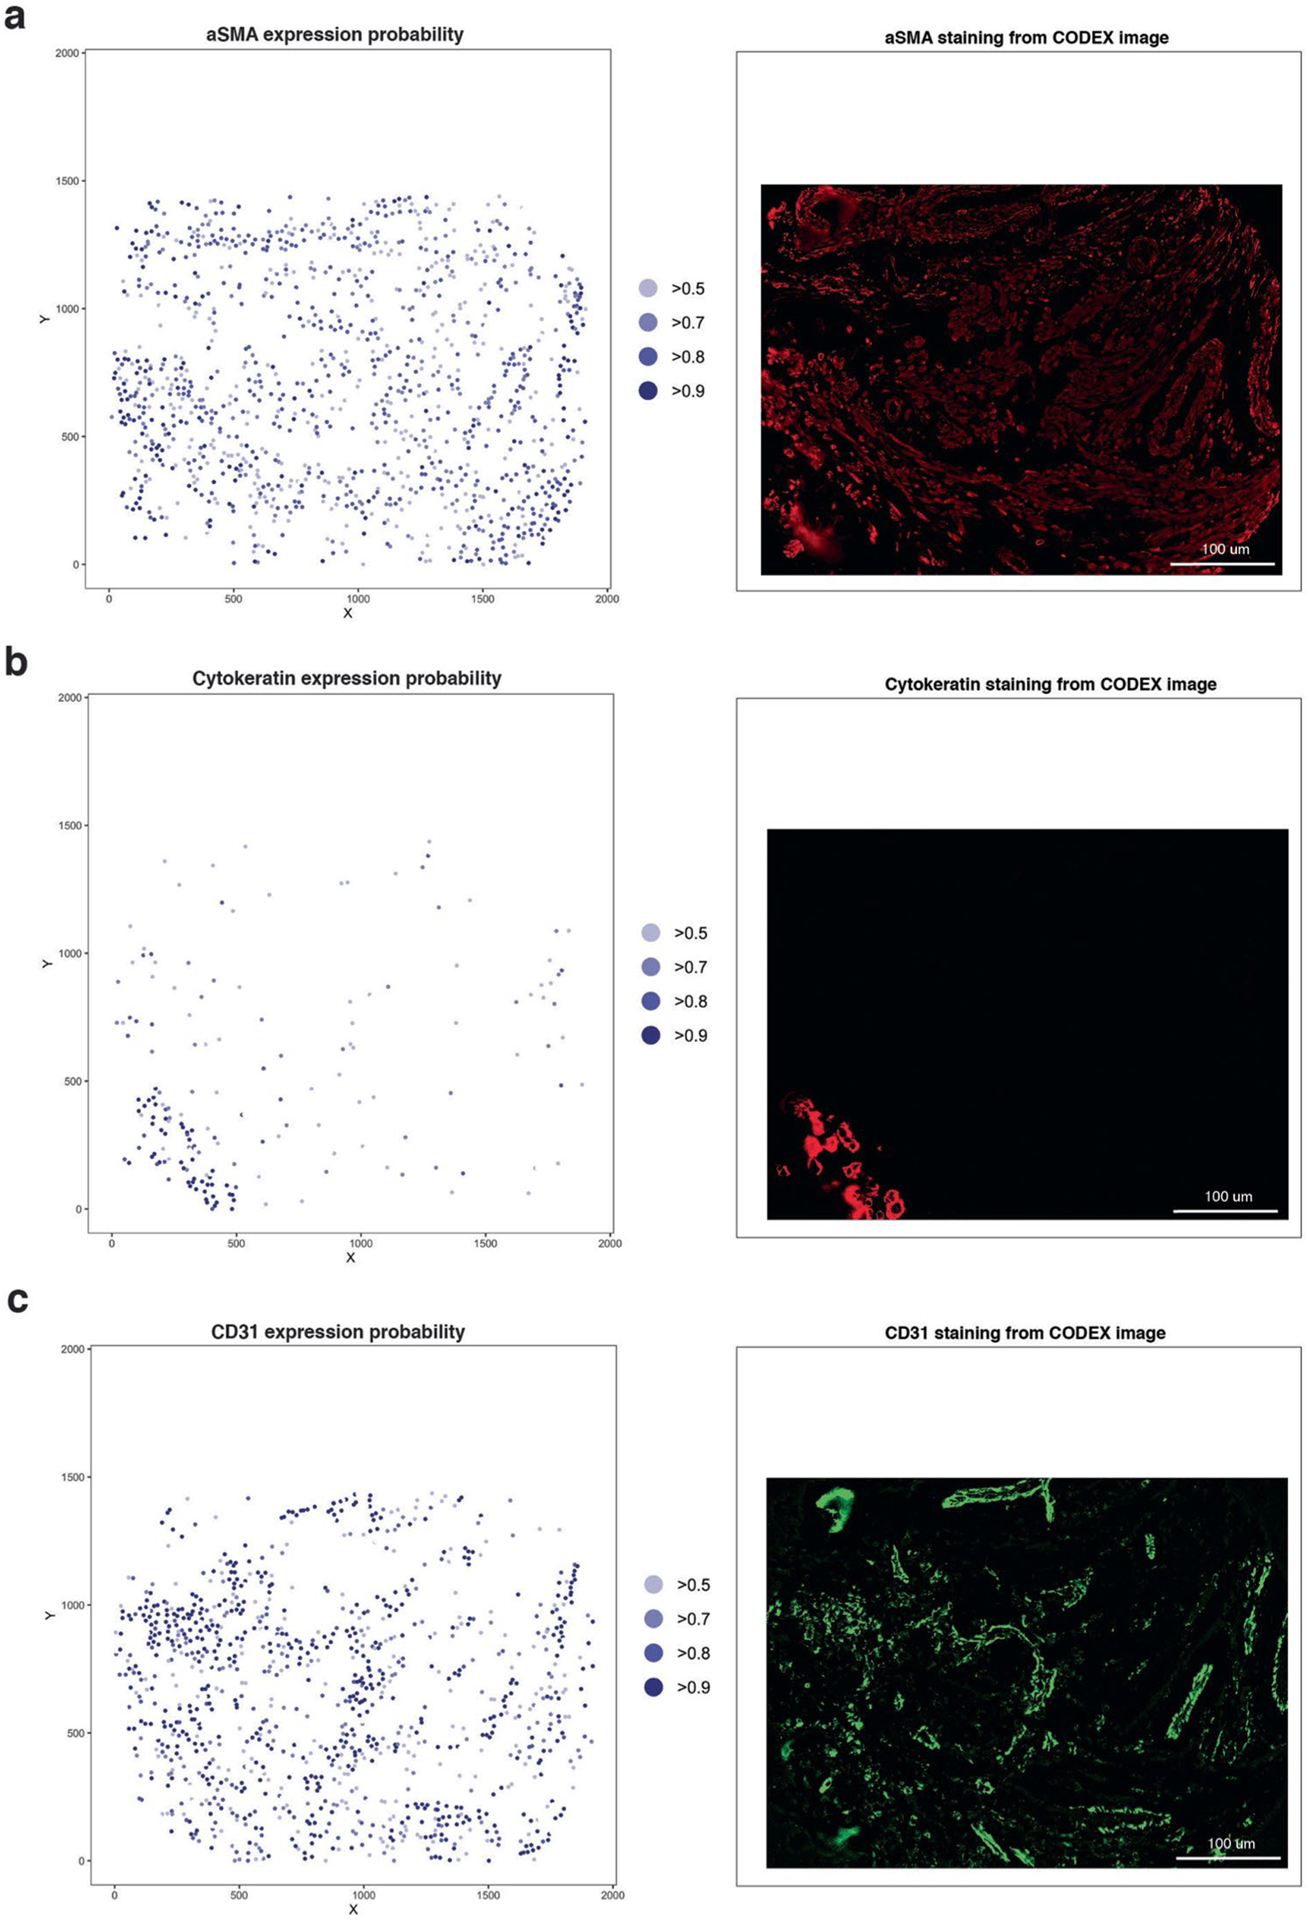
Extended Data Fig. 4 |. Comparison of expression probabilities versus original staining across a representative sample.

Expression probability for a given marker for each cell CELESTA (left) compared to marker staining on the original image (right). For the CELESTA result, the marker expression probability is shown at the XY coordinates of the cell, where the XY coordinates represents the cell’s center; marker expression probabilities are color-coded for values over 0.5 in light blue to over 0.9 in dark blue. Markers illustrated are: (a) aSMA, a mesenchymal marker, (b) cytokeratin, a tumor marker and (c) CD31, an endothelial marker.
