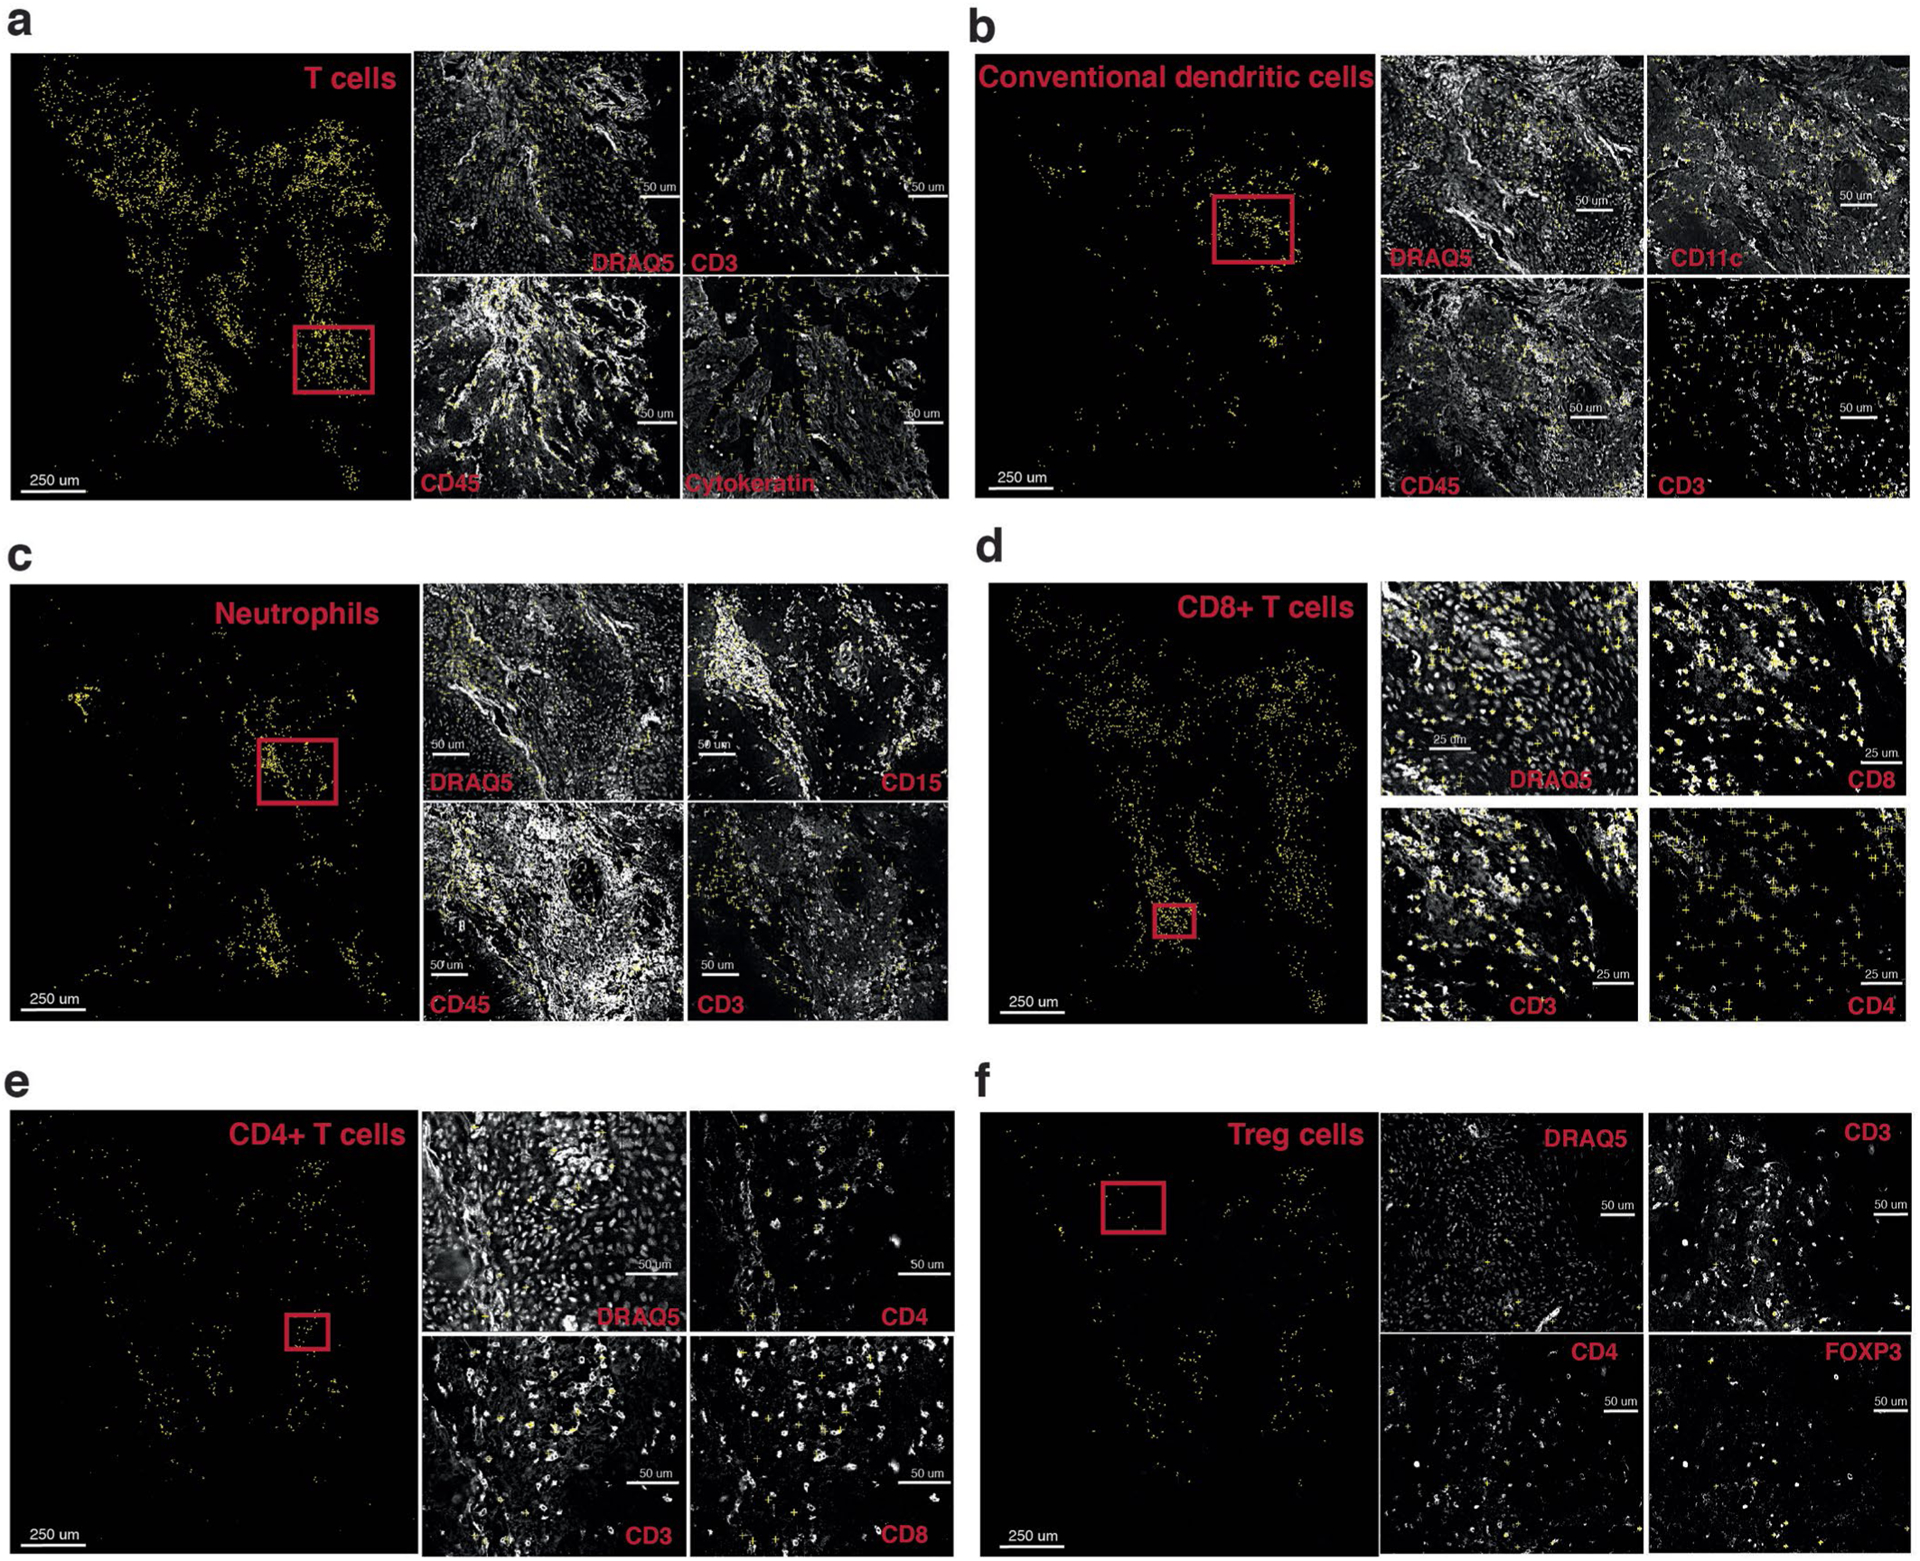
Extended Data Fig. 7 |. Additional visual assessment of CELESTA’s performance for a representative HNSCC sample.

(a)–(f) Identified cells are shown as yellow crosses using the x and y coordinates overlaid on canonical marker staining (white) CODEX images. For each cell type, nuclei staining and three example markers (positive and negative) important for the cell type are shown. Cell types shown (a)–(f): T cells, conventional dendritic cells, neutrophils, CD8 + T cells, CD4 + T cells, Treg cells.
