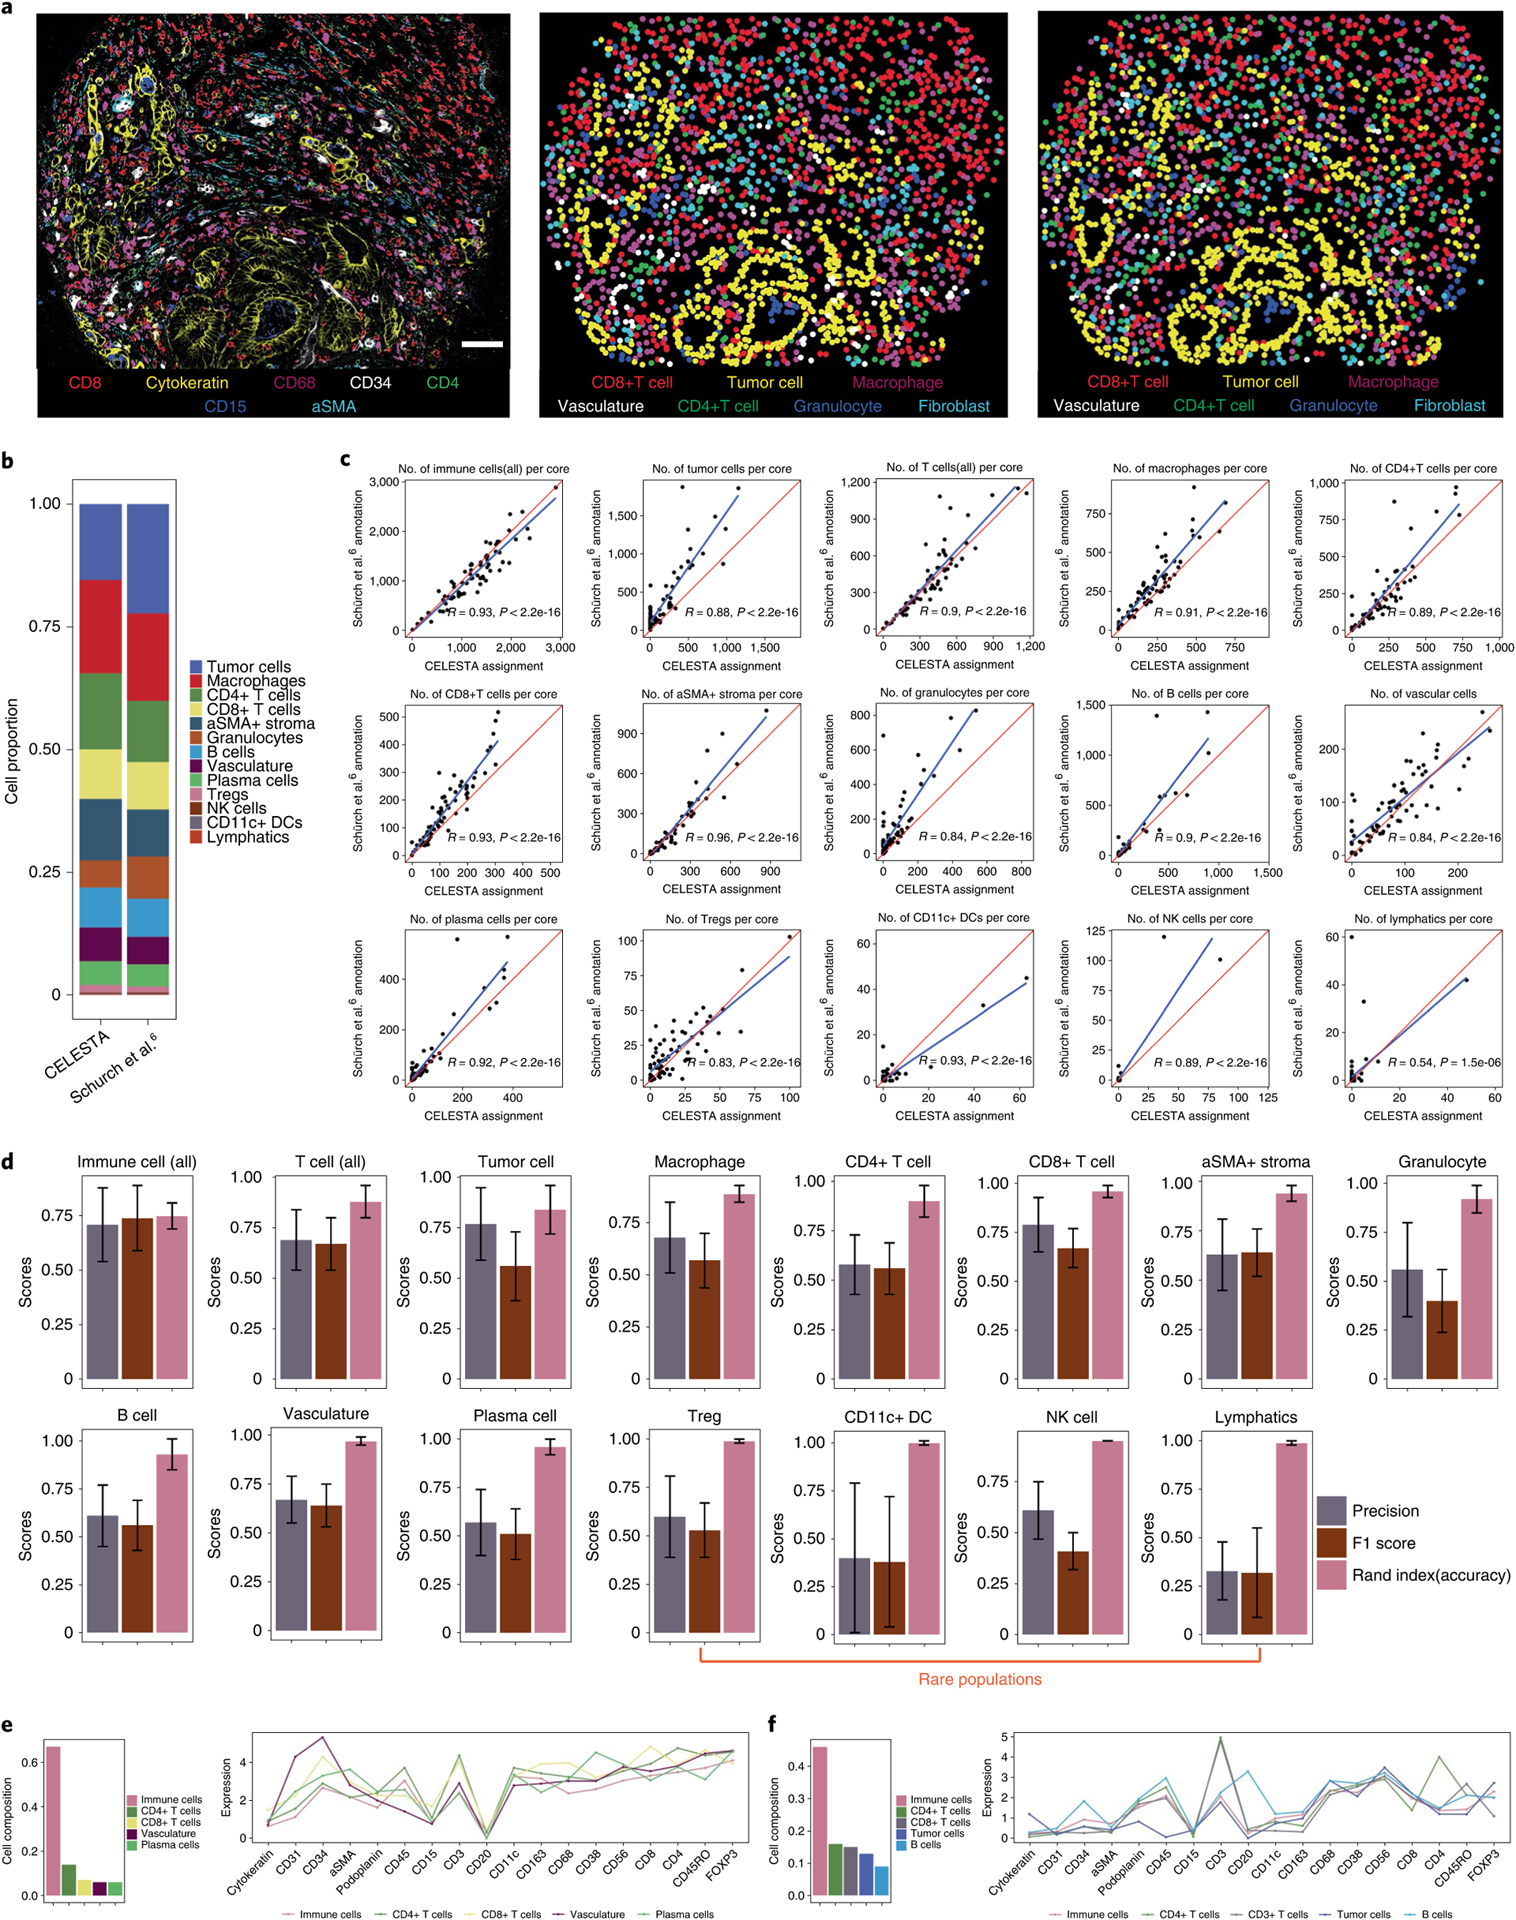
Fig. 3 |. CELESTA applied to a published CodEX dataset generated from a TMA of colorectal cancer primary samples (Schürch et al.6).

a, Representative TMA core with seven-channel overlay CODEX image (left), image using CELESTA-assigned cell types (middle) and image using annotated cell types from Schürch et al.6 (right). Scale bar, 50 μm. b, Cell type composition from CELESTA-assigned cell types versus annotations from Schürch et al.6, across the 70 cores of the entire TMA. c, Correlations between the number of cells identified, per TMA core across 70 cores, between the CELESTA and Schürch et al.6 annotations, for each cell type. The red line indicates a perfect correlation (slope = 1) and the blue line is the linear fit between the CELESTA-identified cell types and the Schürch et al.6 annotations. R represents the Pearson correlation coefficient. d, Precision score, F1 score and accuracy (Rand index) score for the major cell types identified by CELESTA using the Schürch et al.6 annotations as the ground truth. Error bars are calculated using s.d. across all of the cores (n = 70) as independent samples; the center of the error bars indicates the mean. A cell type is defined as rare if it has, on average, fewer than 100 cells per core. e,f, CELESTA cell type assignments for a cluster that Schürch et al.6 annotated as a mixture of vasculature or immune cells (e) and as a mixture of tumor or immune cells (f). CELESTA cell type compositions are shown in the left panels and the average canonical marker expressions for each cell type in the cluster are shown in the right panels. aSMA, alpha-smooth muscle actin.
