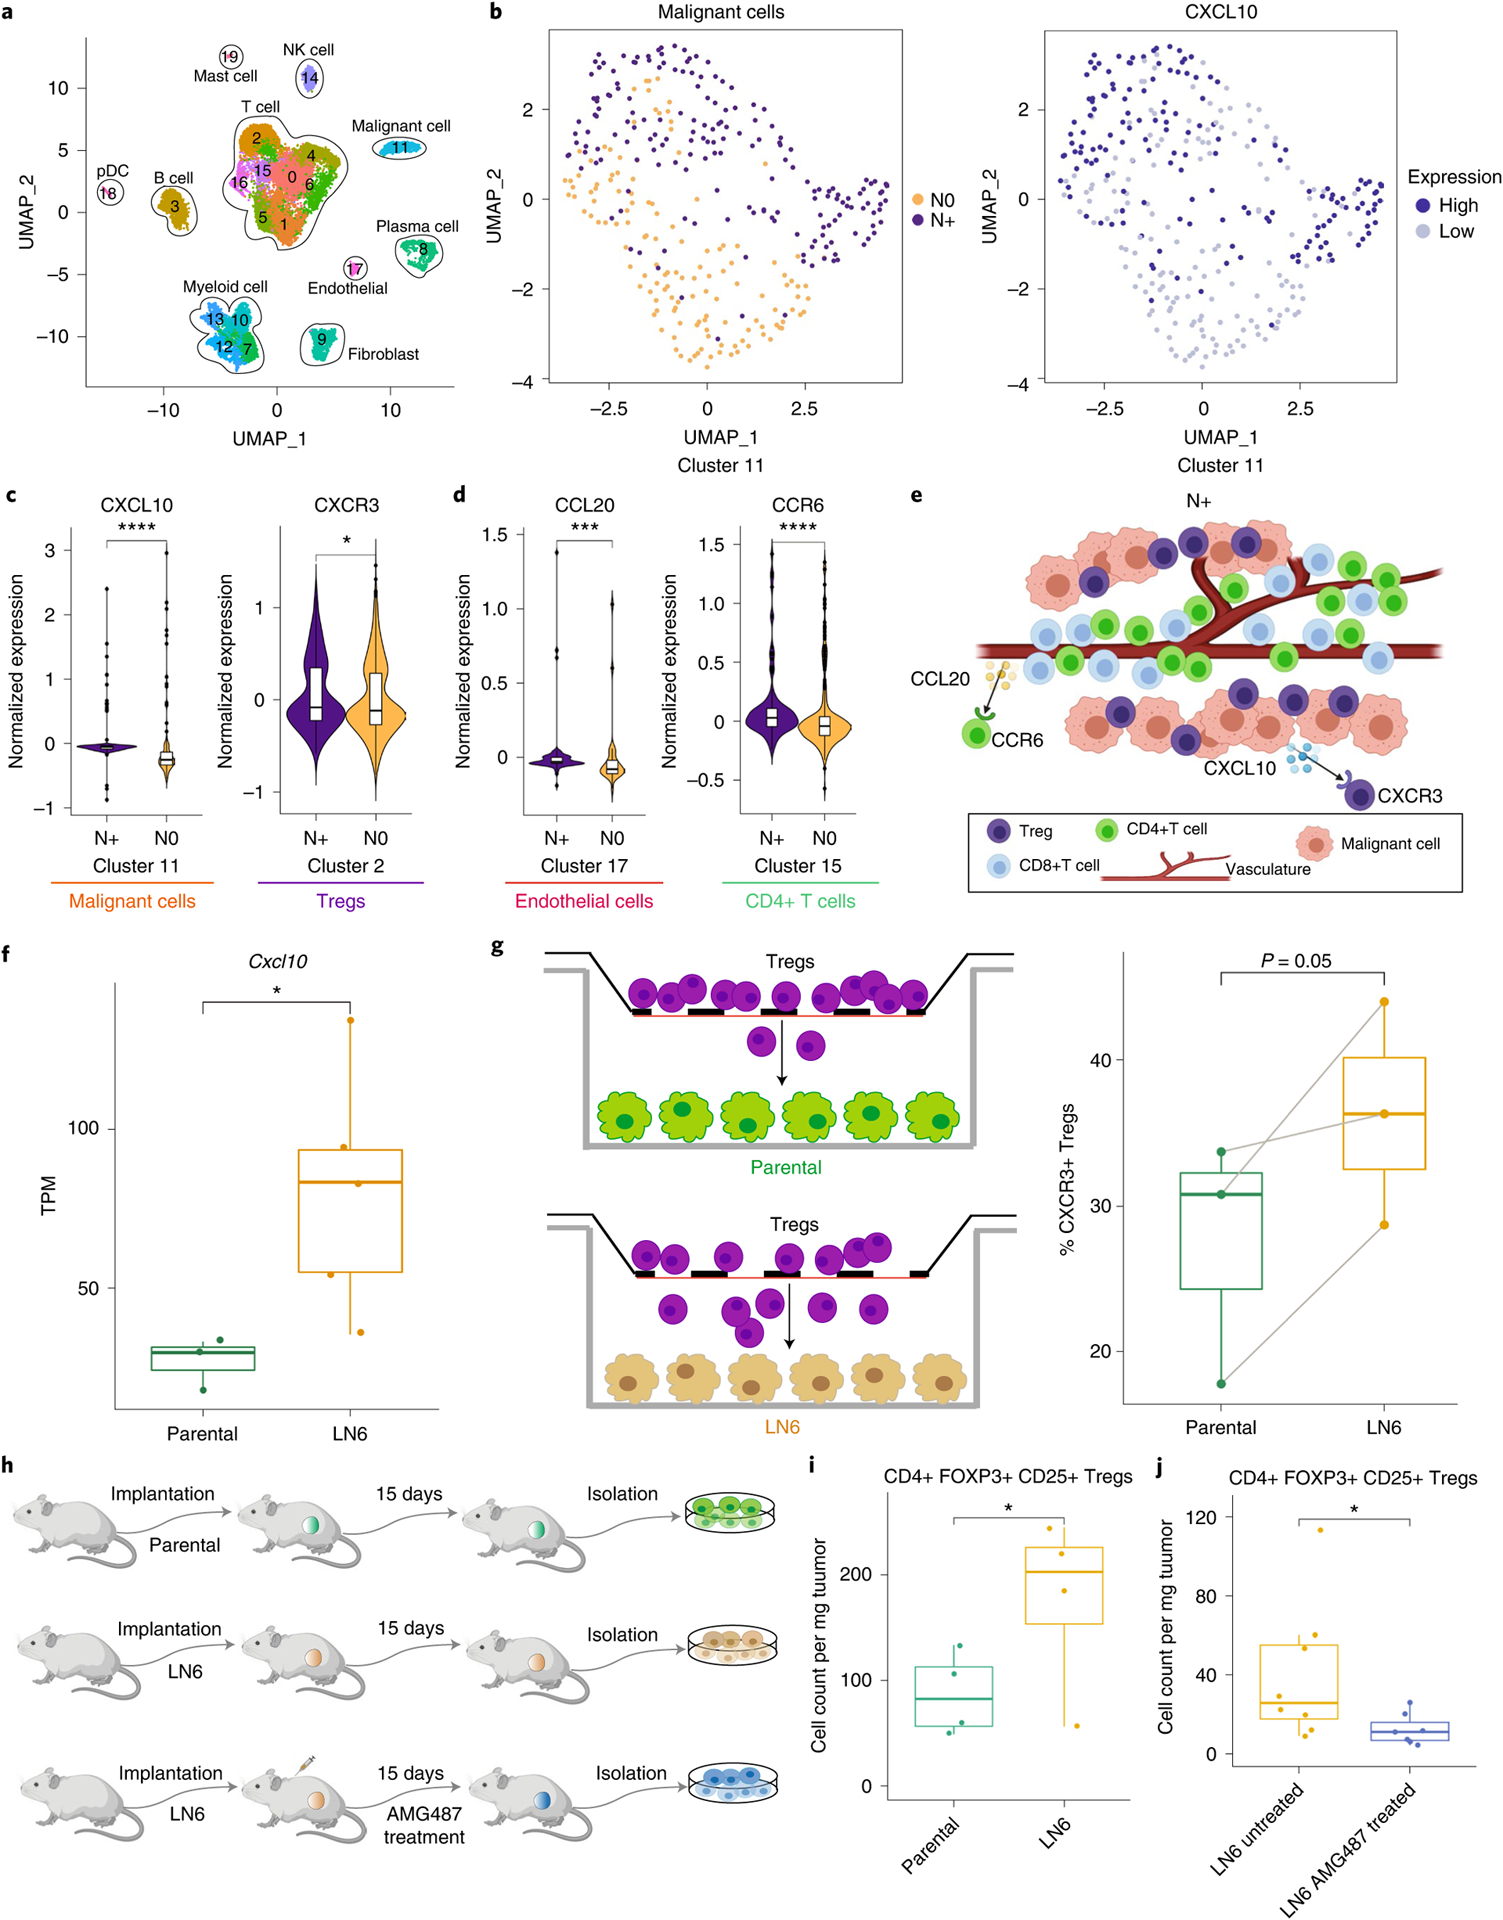
Fig. 6 |. scRNA-seq analysis guided by spatial biology reveals cell–cell interactions unique to primary HNSCC associated with lymph node metastasis.

a, UMAP (Uniform Manifold Approximation and Projection; an algorithm for dimension reduction) of identified cell type clusters using HNSCC scRNA-seq data. b, UMAP of malignant cells (cluster 11) by node status (left) and CXCL10 expression (right). c,d, Violin plots showing the differential expression of CXCL10 and CXCR3 in malignant and Treg cell clusters (c) and CCL20 in an endothelial cell cluster and CCR6 in a CD4+ T cell cluster (d) between N+ (n = 2) and N0 (n = 2) samples. Differentially expressed genes were identified using SAMR (Significance Analysis of Microarrays in R) and the false discovery rate was used to adjust the P values. Violin plots show density distributions of the data. Center line of the box defines median. The white box in the center of the violin defines the interquartile range. The black line stretched above from the box defines 1.5 times interquartile range above the 75th percentile, and the black line stretched below from the box defines 1.5 times interquartile range below the 25th percentile. e, Graphical illustration showing the cell–cell crosstalk with identified chemokine ligand–receptor pairs mediating the cellular spatial co-localization in N+ samples. Created with BioRender. com. f, CXCL10 expression is significantly higher (two-sided non-parametric Wilcoxon test) in the sixth generation of a lymph node tumor cell line (LN6) in a mouse model (n = 5) than in the parental (n = 3) tumor cell lines (P = 0.036). TPM, Transcripts Per Kilobase Million. g, Transwell experiment showing that LN6 tumor cells attract more CXCR3+ Tregs through the membrane than parental tumor cell lines (paired t-test right-tailed, P = 0.05). Tregs were plated in the upper chambers; the bottom chambers were plated with either the parental cells (control group, n = 3) or LN6 cells (study group, n = 3). h, Schematic diagram of the in vivo experiments. Created with BioRender.com. i, LN6 (n = 4) tumors recruit more Tregs than parental (n = 4) tumors (paired t-test right-tailed, P = 0.034). j, AMG487 treatment significantly reduces the number of Tregs recruited into the LN6 tumors (two-sided non-parametric Wilcoxon test, P = 0.029). Untreated samples, n = 8, and treated samples, n = 7. The center line of the box plot defines the median, the top whisker indicates the largest value within 1.5-fold the interquartile range from the 75th percentile, the bottom whisker indicates the smallest value within 1.5-fold the interquartile range below the 25th percentile, and the upper and lower bounds of the box indicate the 75th and 25th percentiles, respectively. *adjusted P < 0.05, **adjusted P < 0.01, ***adjusted P < 0.005, ****adjusted P < 0.001.
