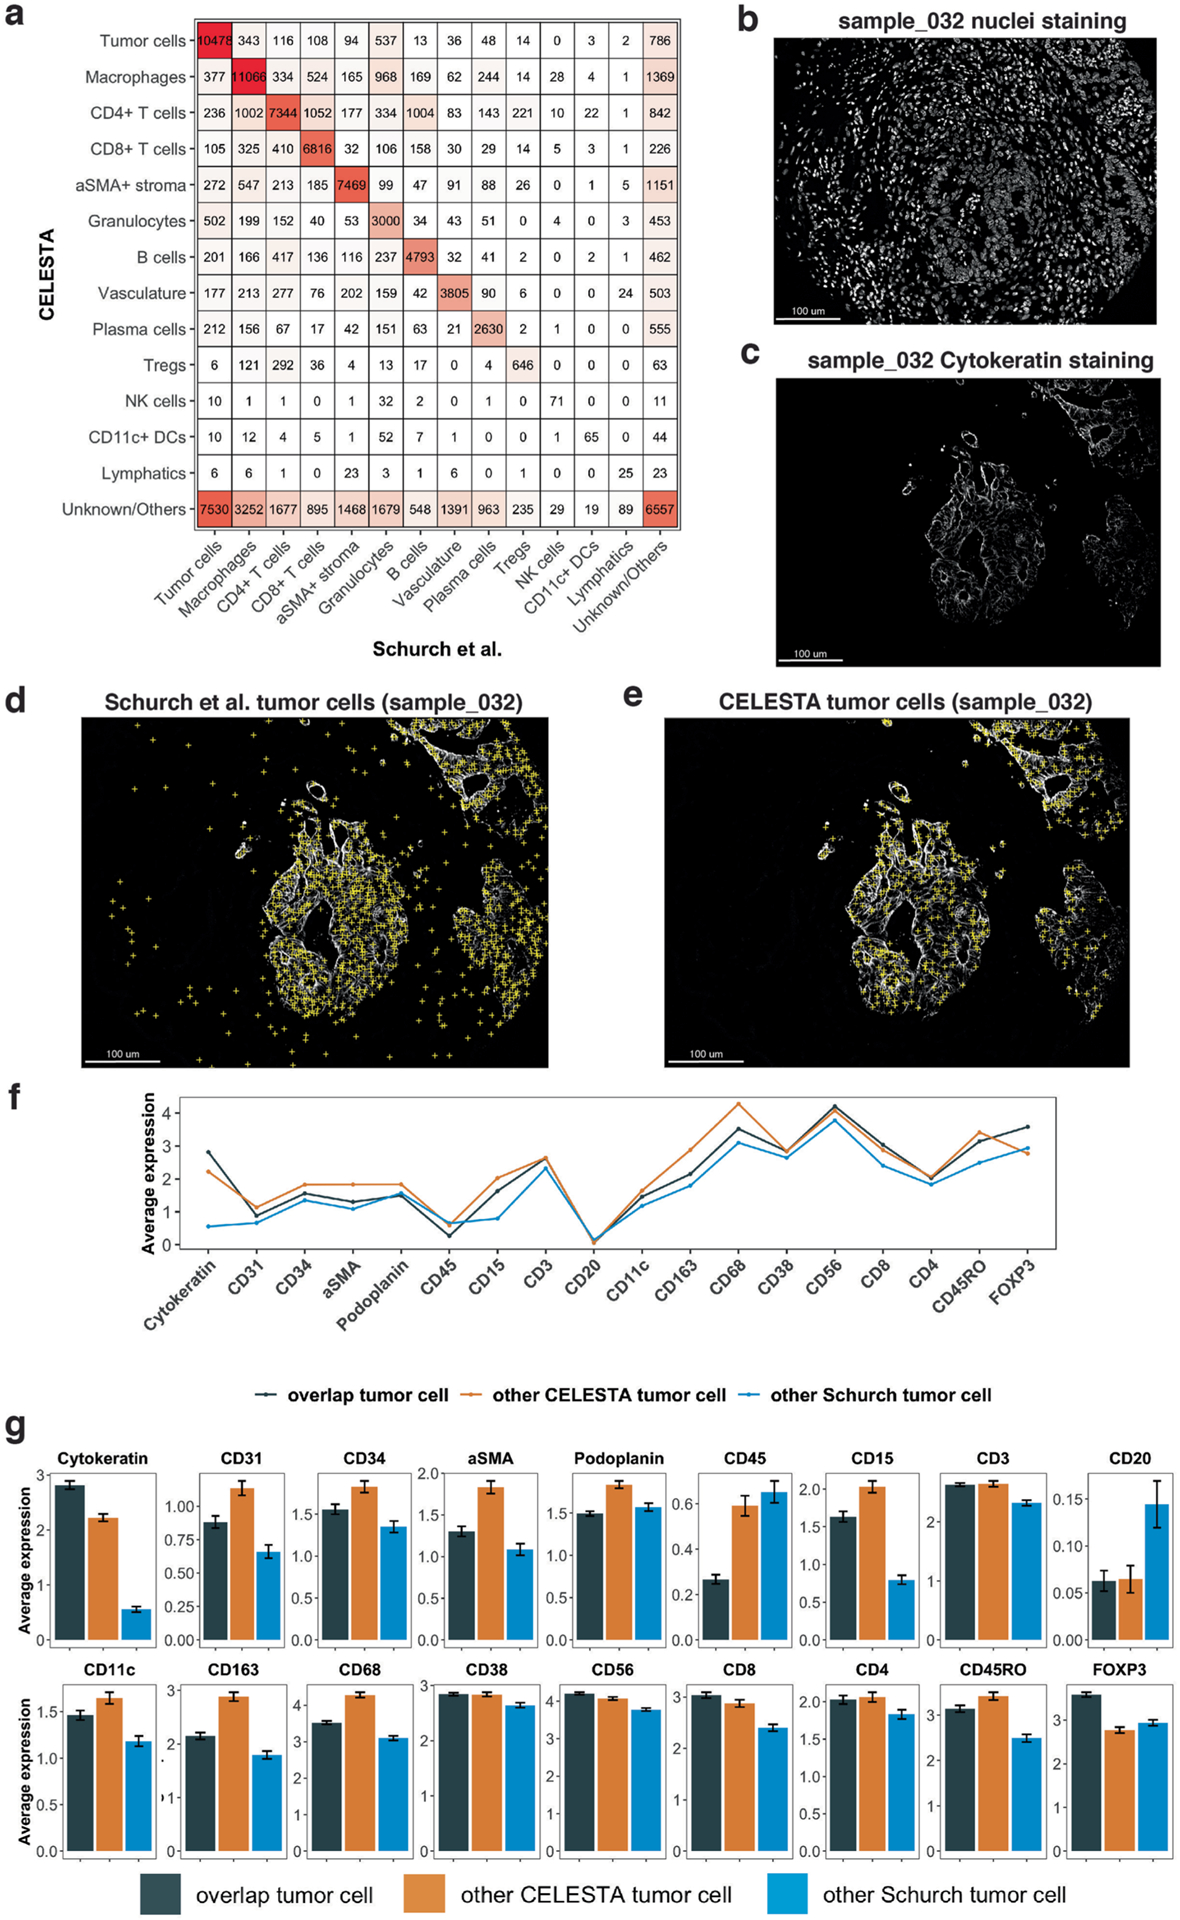
Extended Data Fig. 2 |. Comparison between CELESTA and Schurch et al.6 annotations on the colorectal cancer dataset.

(a) Confusion matrix for each cell type identified by CELESTA (rows) versus Schurch et al.6 (column) for 70 samples. White to red color indicates values from low to high. (b) Nuclei staining for sample core 032. (c) Cytokeratin staining for sample core 032. (d) Tumor cells identified by Schurch et al. (yellow crosses) overlaid on cytokeratin staining for sample core 032. (e) Tumor cells identified by CELESTA overlaid on cytokeratin staining for sample core 032. (f) Average canonical cell type marker expressions across all the 70 samples on cells identified to be tumor cells by (i) both CELESTA and Schurch et al. (black), (ii) only CELESTA (orange), and (iii) only Schurch et al. (blue). (g) Similar to (f) but with error bars indicating 95% confidence interval based on sampling the same number of cells from each category across n = 70 samples and center values indicate mean values.
