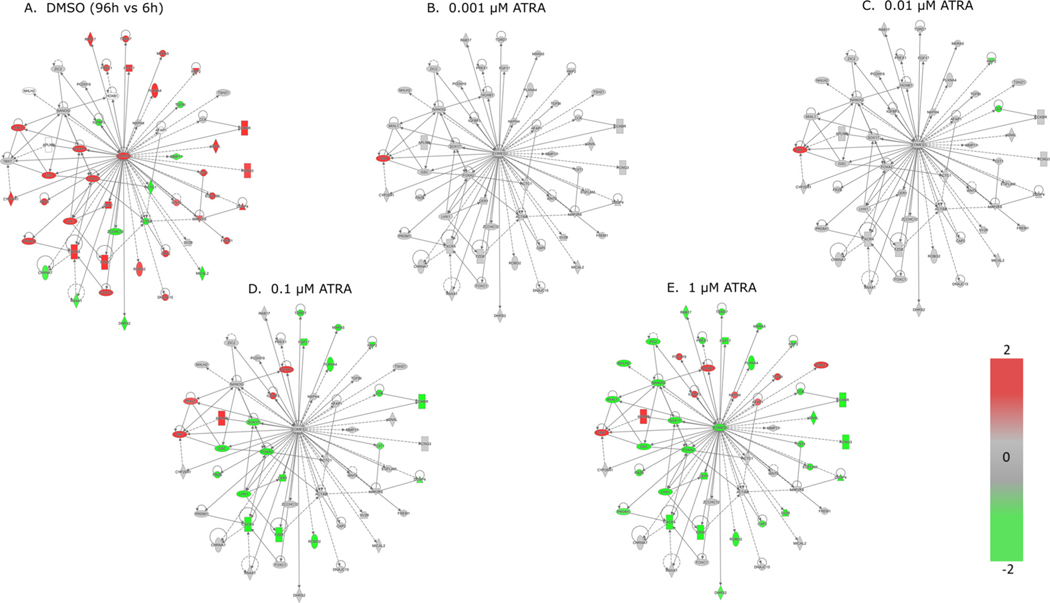
Fig. 6.
Ingenuity pathway analysis of upstream regulator, EOMES, and associated molecular targets at 96 h: A) DMSO fold change at 96 h v 6 h; B – E) ATRA fold change versus time-matched control at 96 h. Red = increase; green= decrease; grey = no change (i.e., gray nodes have same expression values as controls in A). (For interpretation of the references to color in this figure legend, the reader is referred to the web version of this article).

