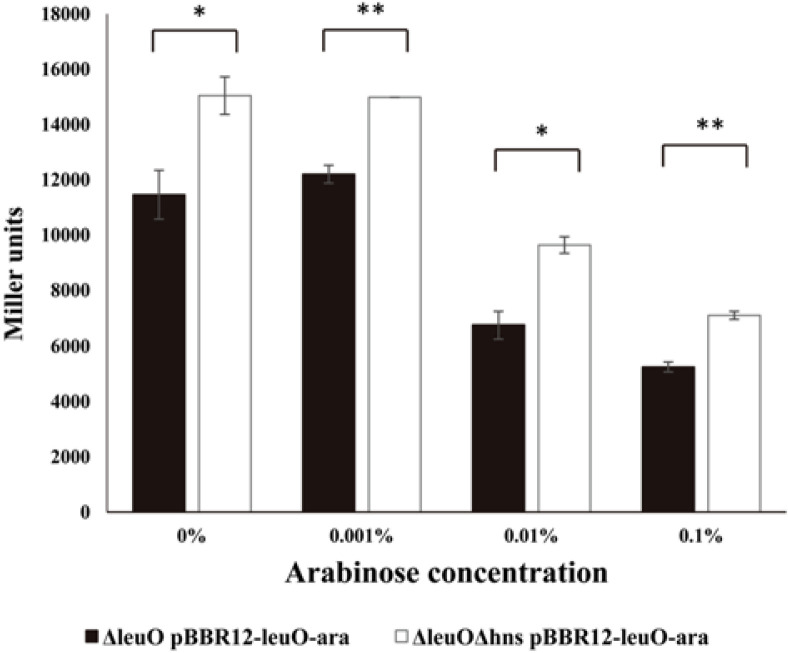
Fig. 2. Transcription levels of leuO regulated by various concentrations of LeuO in the presence or absence of the H-NS.
Transcription levels of leuO as measured by β-galactosidase activities from ΔleuO(pBBR12-leuO-ara) (solid bars) or ΔleuOΔhns(pBBR12-leuO-ara) (open bars) harboring pMZtc-leuO. Culture conditions are described in Materials and Methods. To induce the expression of LeuO, the culture was split into four aliquots after reaching an A600 of 0.4, and then various concentration of L-arabinose were added (0, 0.001, 0.01, 0.1%). Error bars denote standard deviations of three independent experiments (**p < 0.005; *p < 0.05 in Student’s t test).

