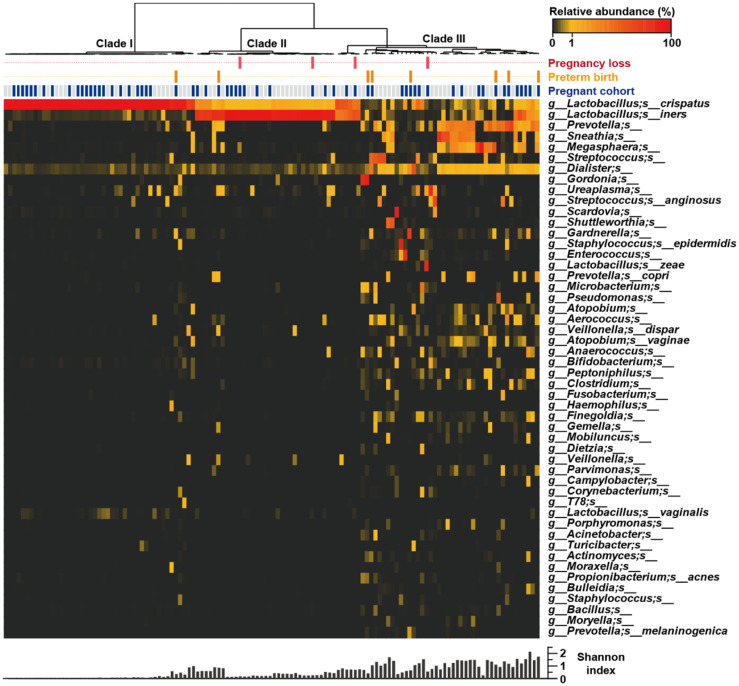
Fig. 2.
Heatmap of bacterial relative abundance by individual vaginal samples. Each column represents the relative bacterial abundance of an individual vaginal sample with the 50 most abundant species showed with their taxonomies. The dendrogram was drawn based on the hierarchical clustering solution (Ward’s method) of the 126 vaginal microbiome samples. Shannon diversity indices calculated from each vaginal samples.

