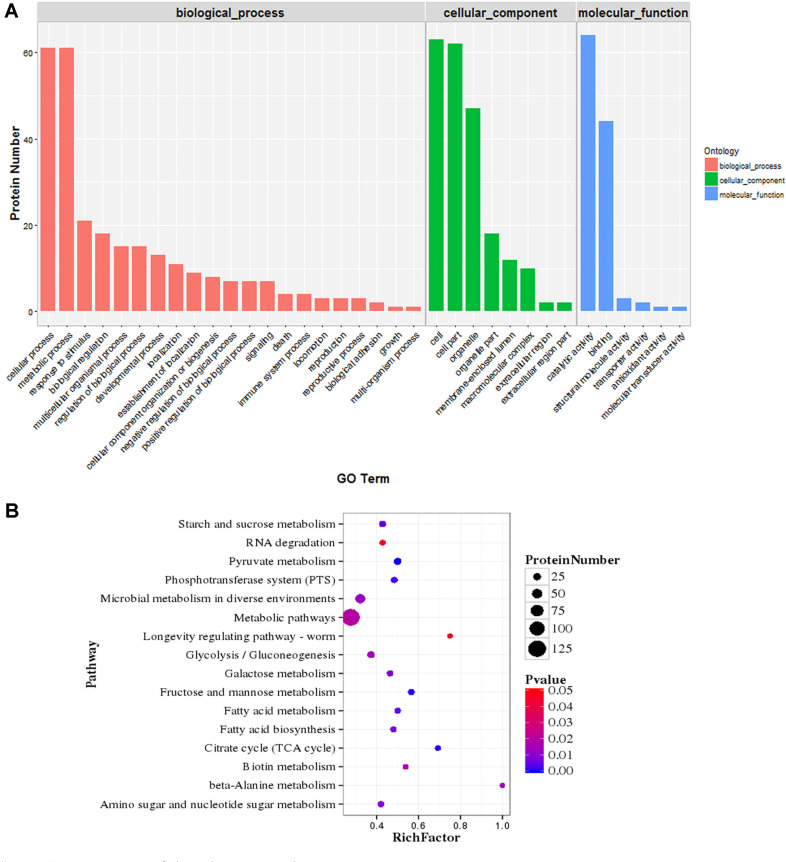
Fig. 3.
GO and KEGG annotation of distribution analysis. (A) Functional categorization of identified proteins according to the Gene Ontology Consortium classification. The vertical scales are protein numbers. Blue bars refer to DE proteins involved in molecular component; Green bars refer to DE proteins in cellular component; Pink bars refer to DE proteins involved in biological process. (B) Pathway classification based on KEGG enrichment analysis of differentially expressed proteins of L. plantarum K25 in response to cold stress. Rich factor, the ratio of the number of differentially expressed genes to the number of total genes in this pathway. Proteins with at least 1.5-fold change are shown; adjusted p ≤ 0.05 for all data selected.

