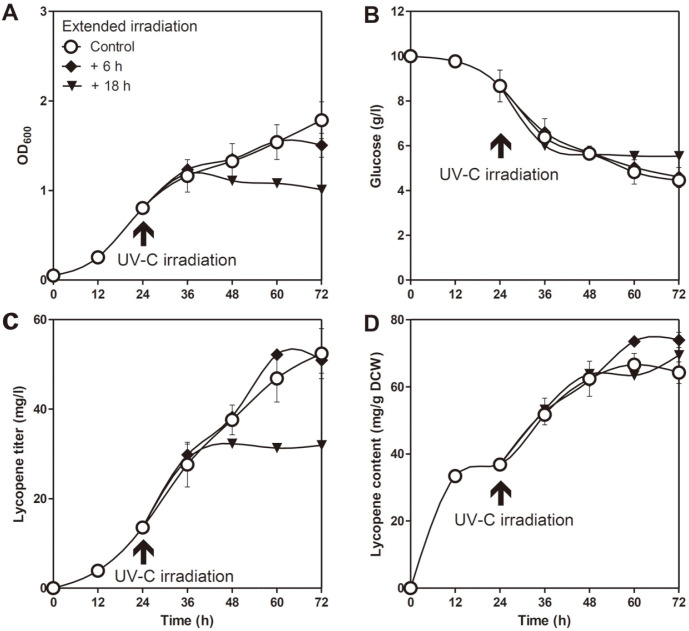
Fig. 4. Optimization of UV-C irradiation duration.
Time-course profiles of (A) cell density, (B) glucose consumption, (C) lycopene titer, and (D) content. Cells were irradiated by UV-C for 6 h (control), 12 h (control + 6 h), or 24 h (control + 18 h). UV-C irradiation was initiated at the mid-exponential phase (24 h) using a 15 W lamp in the shaking incubator. Error bars represent the standard deviations of experiments conducted in triplicate.

