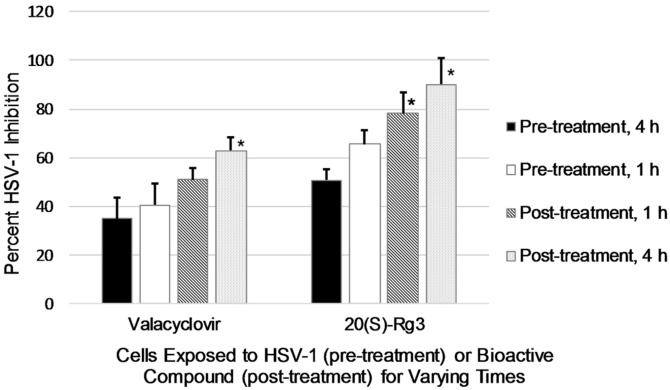
Fig. 3.
Percent HSV-1 inhibition. Cells were exposed to virus before the addition of bioactive compounds (pre-treatment; 4 h = black bars, 1 h = white bars) or exposed to bioactive compounds prior to virus being added (posttreatment; 4 h = stippled bars, 1 h = hatched bars). The asterisks indicate significant differences between 4 h pre-treatment values and post-treatment, p < 0.05.

