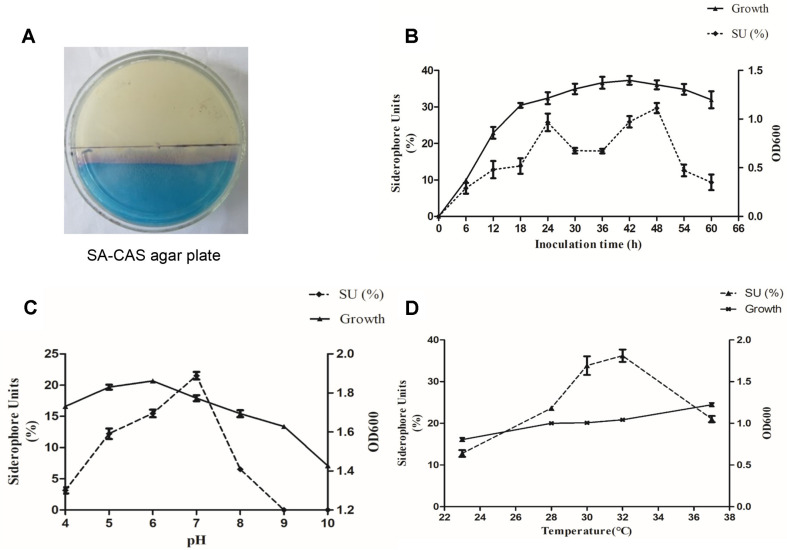
Fig. 1. Effect of fermentation time, pH, temperature on siderophore production and cell growth of GZDF3.
(A) GZDF3 was cultured on SA-CAS agar plate, and the pink region means GZDF3 produces the siderophore. (B) The siderophore and cell growth curve graph. GZDF3 was cultured in SA medium and collected sample at different time points as shown in figure. OD600 was detected via multiscan spectrum instrument to evaluate the cell growth (right vertical axis). Siderophore content was determined by CAS liquid assay as described in Materials and Methods (left vertical axis). (C, D) Similar to (B), GZDF3 was cultured in SA medium with different pH (C), temperature (D) as shown in figure. And sample was collected and detected as described above. All data were collected and analyzed in one graph. Error bars represent standard deviations of three replicates.

