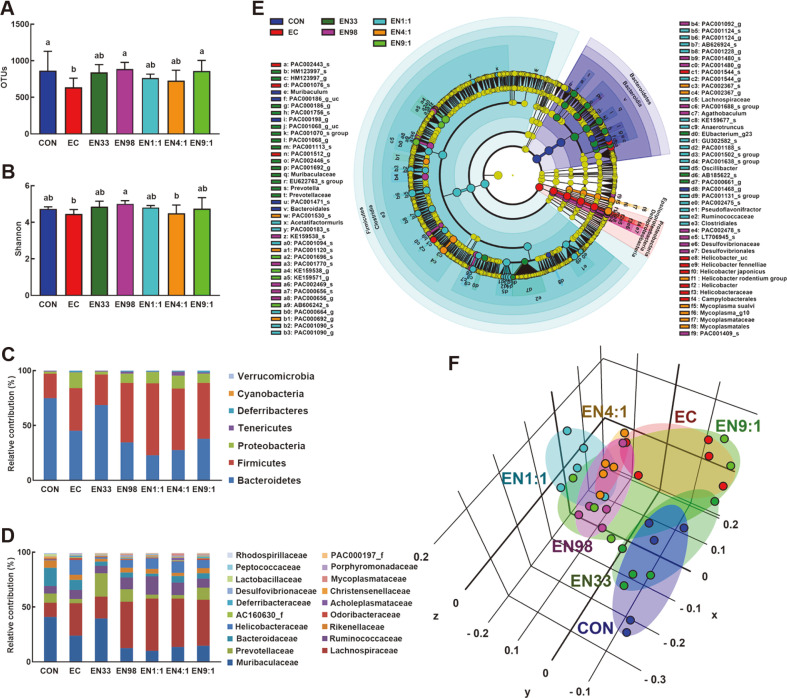
Fig. 3. Oral gavage of Lactobacillus reuteri NK33 and/or Bifidobacterium adolescentis NK98 shifted Escherichia coli K1-induced gut microbiota alteration in mice.
Effects on the composition of gut microbiota, analyzed by the pyrosequencing: OTUs (A) and Shannon’s diversity (B), principal coordinate analysis (PCoA) plot based on Jensen-Shannon analysis (C), phylum (D), family (E), and cladogram (F) generated by LEfSE indicating significant differences in gut microbial abundances among CON (blue), EC (red), EN33 (purple), EN98 (green), EN1:1 (blue-green), EN4:1 (orange), and EN9:1 (chartreuse) groups. The threshold logarithmic score set at 3.5 and ranked. Yellow nodes represent species with no significant difference. Mice were treated with Escherichia coli K1 and test agents, as described in Figure 1. All data were expressed as mean ± SD (n = 5). Means with same letters are not significantly different (p < 0.05).

