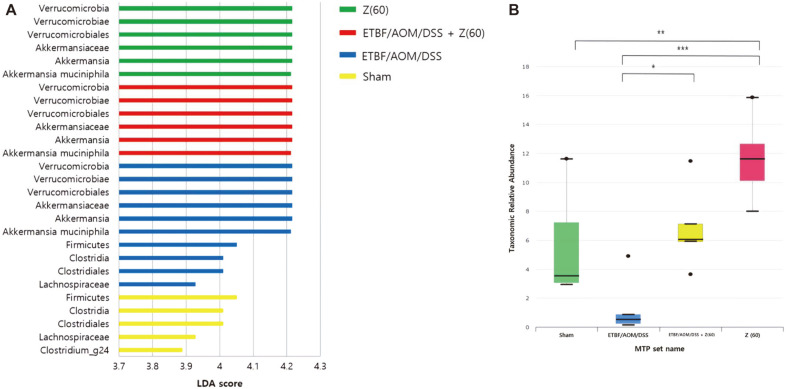
Fig. 4. LEfSe analysis of different abundance levels.
(A) Histogram of LDA scores for different abundance levels. LDA scores represent the effect size of each abundance level. Levels enriched in each group with an LDA score >2 are considered. (B) Taxonomic relative abundant box plot of Proteobacteria. LDA score was calculated using LEfSe, a metagenome analysis approach. Abbreviations of group names are as follows: Sham, sham control; ETBF/AOM/DSS, ETBF colonized AOM/DSS; ETBF/AOM/DSS + Z(60), ETBF colonized AOM/DSS given zerumbone (60 mg kg-1); Z (60), zerumbone (60 mg kg-1).

