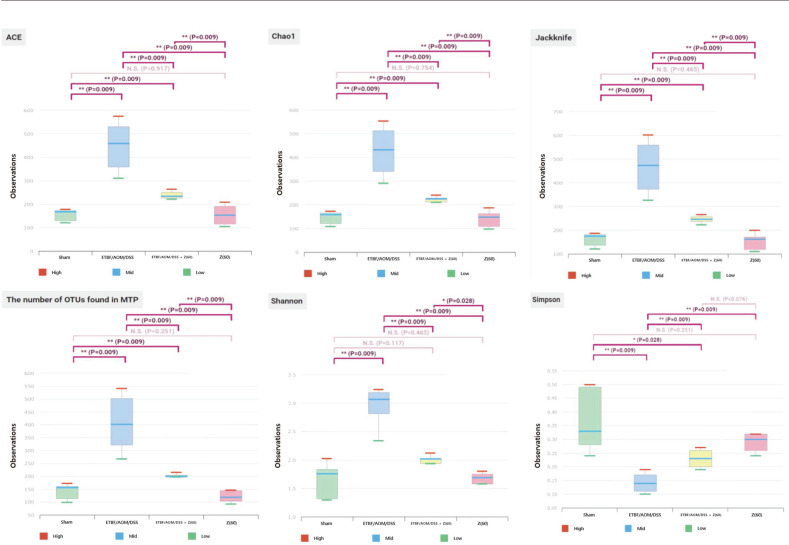
Fig. 5. Alpha-diversity calculated using phylotype relative abundance measurrements in each group.
Box plot shows similar aspest among each group. ETBF/AOM/DSS group tended to be higher than other groups. We measured ACE, Chao1, Jackknife, the number of OTUs found in MTP, Shannon and Simpson index based on 16S rRNA gene sequencing data. Abbreviations of group names are as follows: Sham, sham control; ETBF/AOM/DSS, ETBF colonized AOM/DSS; ETBF Z(60), ETBF colonized AOM/DSS given zerumbone (60 mg kg-1); Z, zerumbone (60 mg kg-1).

