Figure 1.
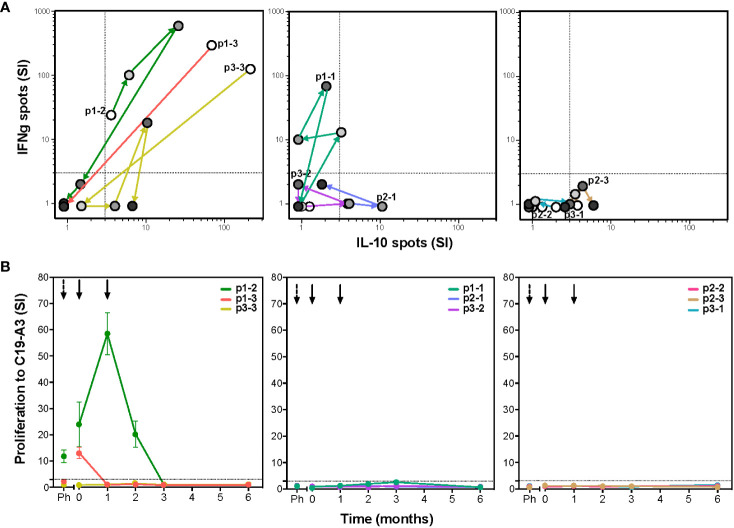
TolDC therapy modulates T-cell responses to the vaccine peptide (C19-A3) (A) The C19-A3-specific T-cells producing cytokines IFNg and IL-10 were quantified using the ELISPOT assay. Left graph shows changes in IFNg/IL-10 production in three patients (p1-2, p1-3 and p3-3) with detectable cytokine responses to C19-A3 prior to tolDC therapy. Middle graph shows responses in three patients (p1-1, p2-1 and p3-2) with a temporary cytokine production to C19-A3 and right graph shows responses in three patients (p2-2, p2-3 and p3-1) with very low responses to C19-A3 prior and after tolDC therapy. For each patient, white circles show the number of cytokine-producing cells prior to tolDC treatment, successive circles with increasing gray tones depict 1, 2, 3 and 6 months post-tolDC therapy values. Patients are coded according to the received tolDC dosage (p1-1 to p1-3 0.5x10⁷ cells; p2-1 to p2-3 1x10⁷ cells and p3-1 to p3-3 2x10⁷ cells). (B) Proliferative response to C19-A3 as determined by the lymphocyte stimulation test (LST). Proliferation was measured in triplicate as counts per minute (CPM) in wells with C19-A3 and stimulation index (SI) calculated as described in material and methods. Time of tolDC injections are indicated with black arrows.

