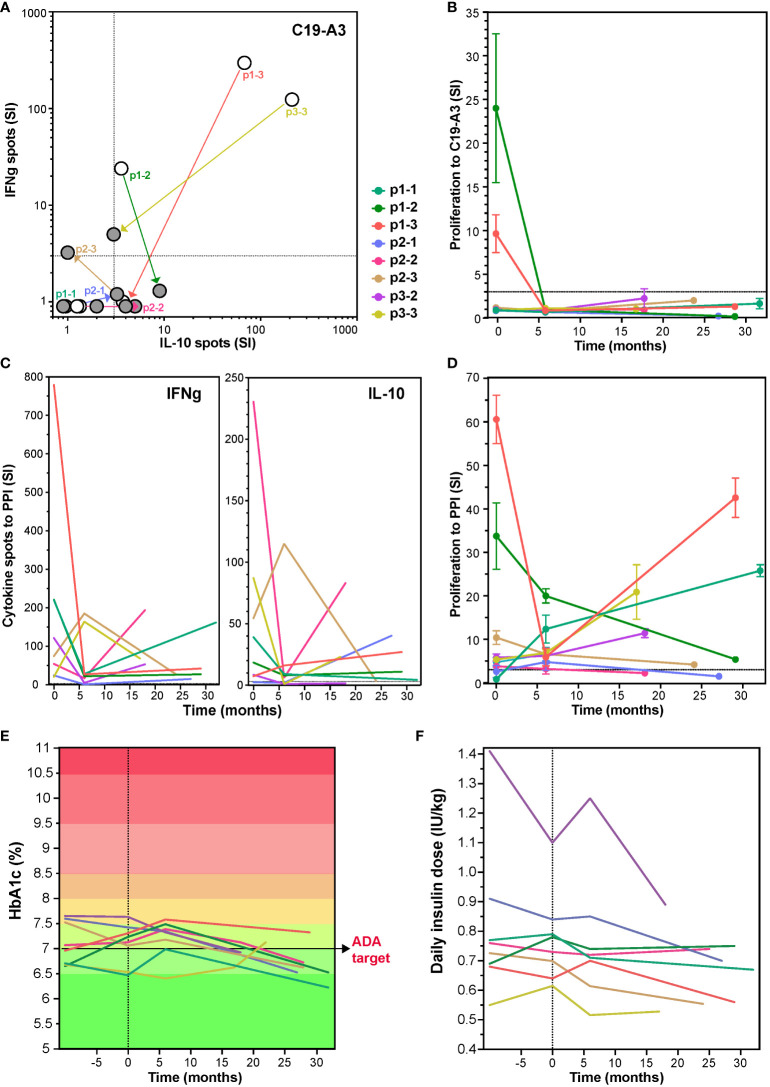
Figure 3.
Change in T-cell responses to C19-A3 vaccine peptide, preproinsulin (PPI) and glycemia control at long term after tolDC therapy. Long-term effect of tolDC therapy on the cytokine response to C19-A3 (A) and PPI (C). Patients reacting to C19-A3 prior to tolDC therapy, retain low response to C19-A3 at revisit and four out of eight patients show predominantly IL-10-producing response. TolDC therapy also reduced cytokine release to PPI with IFNg more strongly reduced than IL-10 in six out of eight patients at revisit (IFNg p=0.0012 and IL-10 p=0.34, paired T-test). White dots in (A) depict the cytokine spots before tolDC and filled dots at revisit. Patient specific values are connected. (B) and (D) Proliferation to C19-A3 peptide (B) and PPI (D) at revisit compared to the values before tolDC treatment. Lines in (B) to (F) represent individual patients coded in color as depicted. Patients p1-2, p1-3 and p2-1 reduced proliferation on the long term, other patients responses remain unchanged except for patient p1-1, showing an increased proliferation to PPI compared to the timepoint before tolDC therapy. (E) and (F) show change in HbA1c and insulin use in time.

