Figure 5.
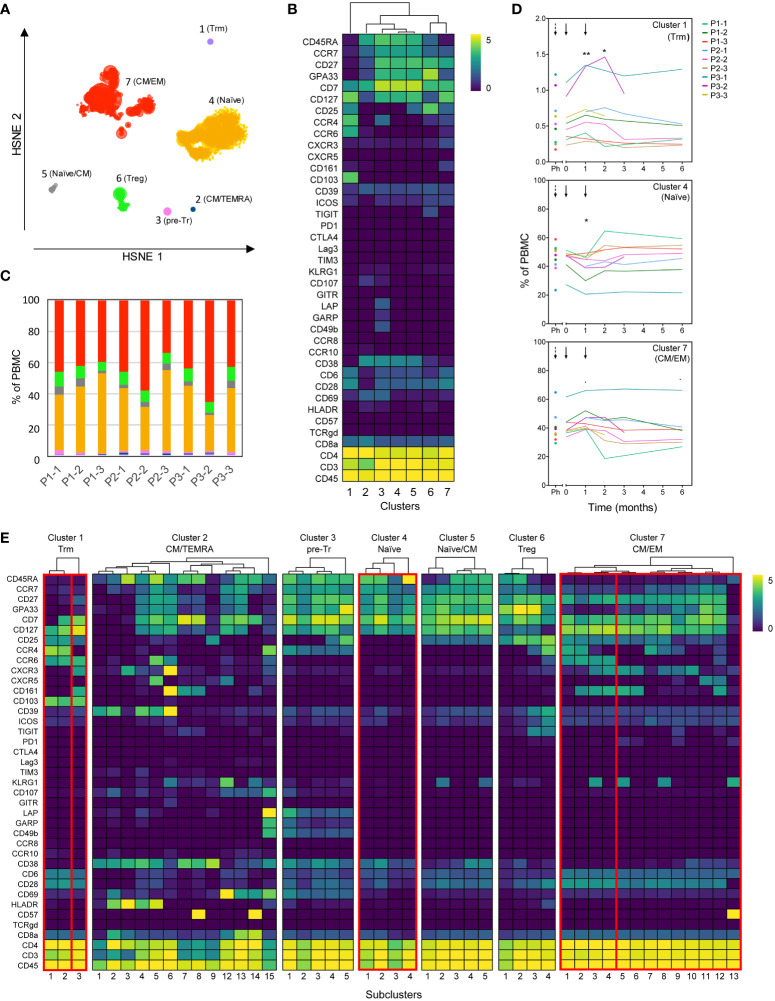
High dimensional analysis of the CD4+ T-cell compartment reveals changes after tolDC treatment. Analysis of CD4+ T-cells from tolDC-treated patients containing multiple timepoints before and after tolDC treatment (n=9). (A) HSNE analysis reveals seven major CD4 + T-cell clusters at the overview level (level 1). (B) Clustered heatmap displays the phenotype of major clusters. (C) Distribution of major clusters within each patient (all timepoints combined). Colors correspond to the HSNE map in (A). (D) Line plots display frequency of clusters for individual patients in time. The frequency in clusters 1, 4 and 7 significantly changed after tolDC treatment (cluster 1; p=0.012, cluster 4; p=0.007 and cluster 7; p=0.010). Black arrows show time of first and second tolDC injection, dashed arrows indicate the timepoint before leukapheresis. Each line represents one patient. (E) The heterogeneity within each major cluster is further explored in a new HSNE analysis (level 2). Generated subclusters are visualized in a heatmap. Boxes indicate significant major- and subclusters. Line plots with change in time of significant subclusters are displayed in Figure S5 . Asterisks in (D) indicate significance levels for individual timepoints, *p<0.05 and **p<0.01.

