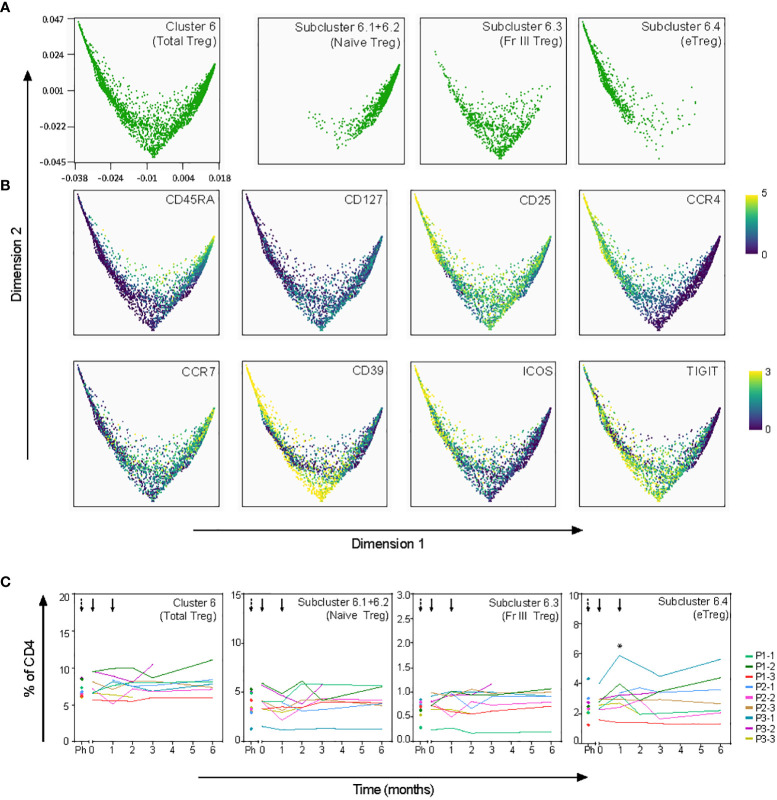
Figure 6.
Effect of tolDC on regulatory T-cell subsets. Pseudotime analysis (diffusion map) shows differentiation trajectory within Treg cluster 6. (A) Treg subclusters as defined in Cytosplore ( Figure 5E ) are visualized in the diffusion map. Subclusters 6.1 and 6.2 are plotted together since both subclusters show a naïve phenotype. (B) Specified markers within the diffusion map. (C) Frequency in time of total Treg and Treg subclusters, shows significant increase of eTregs (subcluster 6.4) 1 month after tolDC treatment (*p=0.035).

