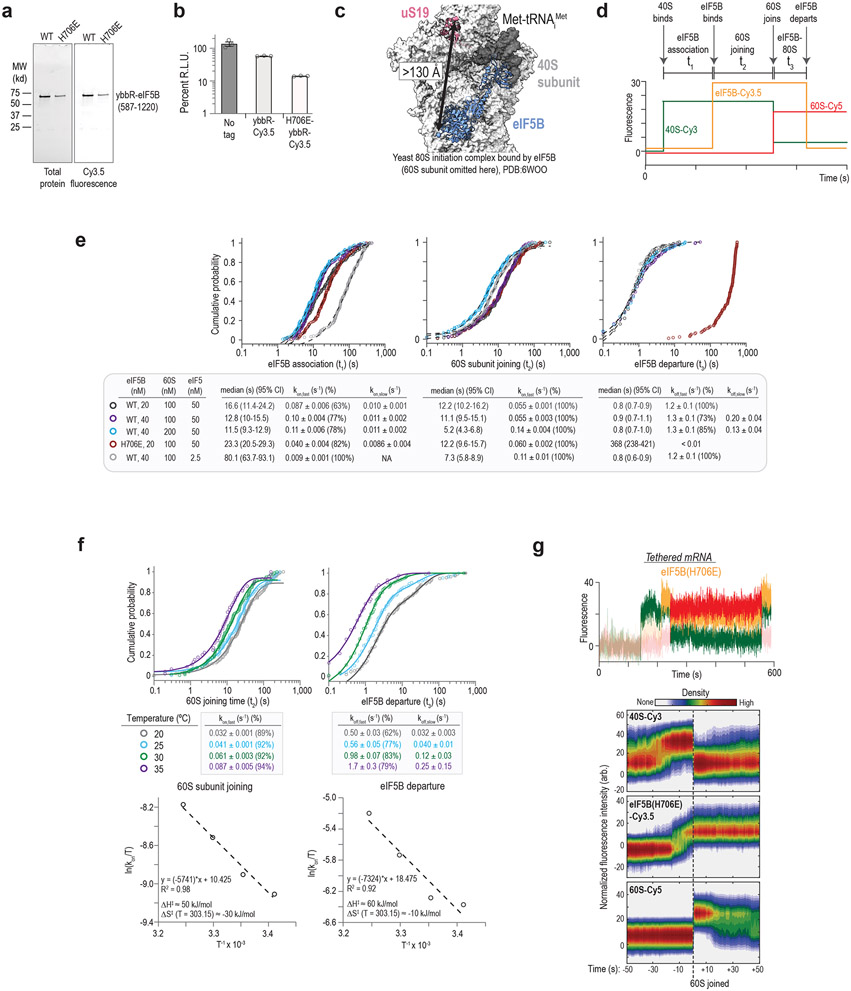
Extended Data Figure 2. Real-time analysis of eIF5B-mediated ribosomal subunit joining in humans.
a. Fluorescence scans of SDS-PAGE gels that analyzed purified and fluorescently-labeled eIF5B proteins. ‘WT’ corresponds to the wild-type protein with the N-terminal domain truncated (residues 1-586 removed) and an N-terminal ybbR peptide tag (11 amino acids). ‘H706E’ corresponds to the GTPase deficient version of the protein. Each protein was analyzed by SDS-PAGE twice. The full scans of the cropped gel are available in Supplementary Figure 1. b. Plot of the relative light units (RLU) from nanoLuciferase in vitro translation assays where the indicated eIF5B proteins were supplemented in the extract (840 nM final concentration). Three replicates (n = 3) were completed and are overlayed on the bar plots. Error bars represent standard error of the mean. c. Structural model of the yeast 80S initiation complex bound by eIF5B (PDB: 6WOO 16) used to predict the potential distance between the human 40S subunit (ybbR tag fused to N-term of uS19) and eIF5B (ybbR tag fused to residue 587) labeling sites. The relatively long predicted distance (>130 Å) precluded detection using FRET. eIF5B therefore was monitored via direct excitation and emission in all experiments. d. Theoretical real-time single-molecule fluorescence data from a ZMW with sequential association of the 40S subunit (green), eIF5B (orange), and 60S subunit (red), which was followed by departure of eIF5B from the newly-formed 80S initiation complex. The dwell times were defined as follows: between appearance of 40S and eIF5B signals, as the eIF5B association time (t1); between appearance of eIF5B and 60S signal, indicated by 40S-60S FRET, as 60S joining time (t2); and between appearance of 60S until loss of eIF5B, as eIF5B departure time (t3). e. Cumulative probability plots of the observed times at the indicated concentrations for eIF5B and 60S subunits at 30 °C. In all experiments, the 43S PIC was present at 10 nM (final concentration, via 40S-Cy3). WT and H706E indicate whether wild-type or catalytically-inactive eIF5B-Cy3.5 were present, respectively. Lines represent fits of observed data to single- or double-exponential functions, which yielded the indicated association or dissociation rates. All errors represent 95% confidence intervals (C.I.). The number of molecules analyzed were: 136 (black), 148 (purple), 134 (blue), 146 (red), and 150 (gray). f. Cumulative probability (top) and Eyring (bottom) plots of observed 60S joining and eIF5B departure times at 20, 25, 30, and 35 °C. These data were obtained using tethered, pre-equilibrated 48S initiation complexes (see, Extended Figure 3a for more details on the experiment setup) to provide sharper focus on eIF5B dynamics and 60S subunit joining. eIF5B-Cy3.5 and 60S-Cy5 subunits were present at 20 nM and 100 nM, respectively. Lines on the cumulative probability plots represent fits of the observed data to single or double-exponential functions, which yielded the indicated rates (errors represent 95% C.I.). Eyring plots (bottom) were modeled via linear regression analyses, which yielded the indicated enthalpies and entropies of activation. The number of molecules analyzed were: 116 (20 °C), 109 (25 °C), 120 (30 °C), and 44 (35 °C). g. Example single-molecule fluorescence data (top) and density plots (bottom) from the tethered mRNA setup when catalytically-inactive eIF5B (H706E) was examined at 30 °C. 40S-Cy3, eIF5B(H706E)-Cy3.5, and 60S-Cy5 subunits were present at 10 nM, 20 nM, and 100 nM, respectively. eIF5B(H706E) was unable to depart the 80S initiation complex in the presence of 1 mM GTP.

