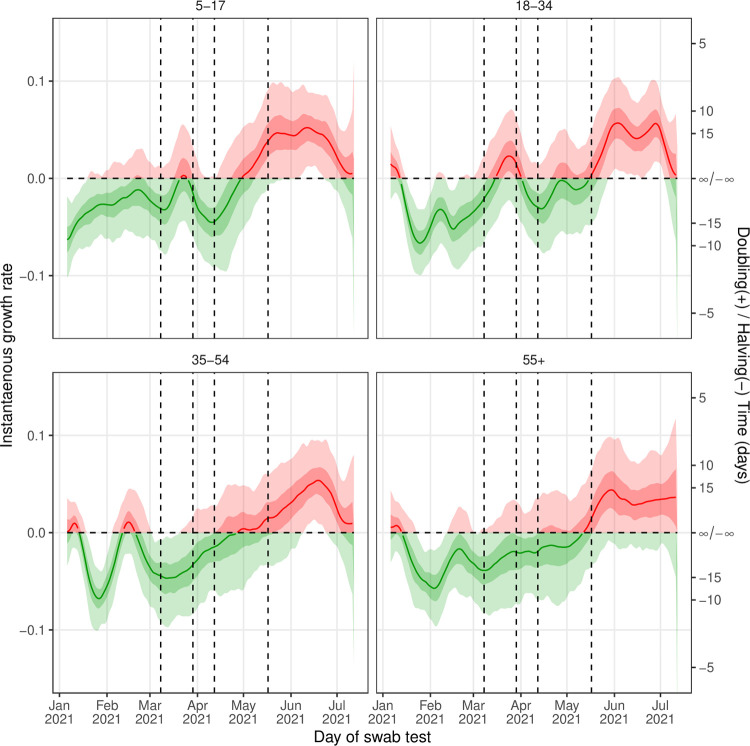
Fig 4. Trends in the instantaneous growth rate by age group.
Instantaneous growth rate as inferred from the Bayesian P-spline models fit to data for each age group. Estimates of the instantaneous growth rate are shown with a central estimate (solid line) and 50% (dark shaded region) and 95% (light shaded region) credible intervals. Estimates are colored by whether their value is greater than 0 (red) or less than 0 (green). Vertical dashed lines show the dates of key changes in restrictions. The horizontal dashed line shows growth rate = 0 the threshold for epidemic growth. The right hand axis gives the corresponding doubling / halving times for a given growth rate.

