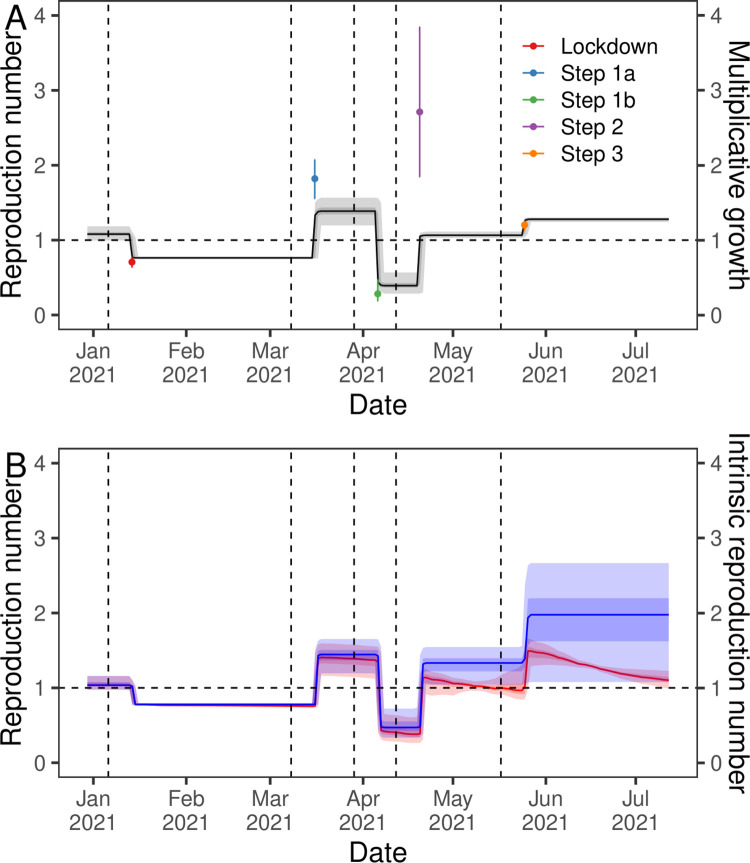
Fig 5. Estimated discrete changes in the reproduction number.
(A) Inferred R over time (black line, left-axis) from the segmented-exponential model fit to rounds 8 to 13 of REACT-1. Also shown is the multiplicative growth in R due to each step change in restrictions (points, right-axis) and their 95% credible intervals (error bars). (B) Inferred R over time (red, left-axis) from the segmented-exponential model including vaccine and Delta fixed effects fit to rounds 8 to 13 of REACT-1. Also shown is the intrinsic R (R if vaccine and Delta effects excluded) over time (blue, right-axis). All estimates of R are shown with a central estimate (solid line) and 50% (dark shaded region) and 95% (light shaded region) credible intervals. Vertical dashed lines show the dates of key changes in restrictions. Horizontal dashed line shows R = 1 the threshold for epidemic growth.

