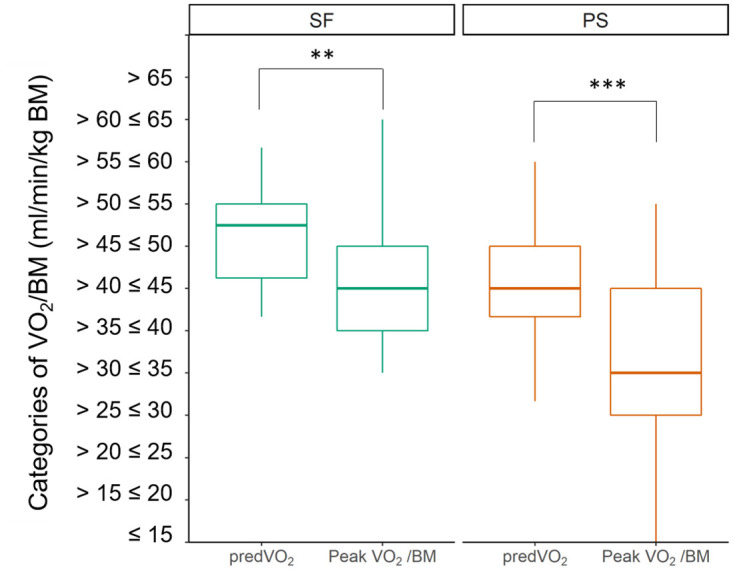
Fig 3. Differences between predVO2 and Peak VO2/BM.

Significant differences of means between the calculated Peak VO2 (predVO2) and in PS and SF at t0 (first examination). In both groups the measured values were significantly below the values predicted for the time before infection. **p<0.01, ***p<0.001.
