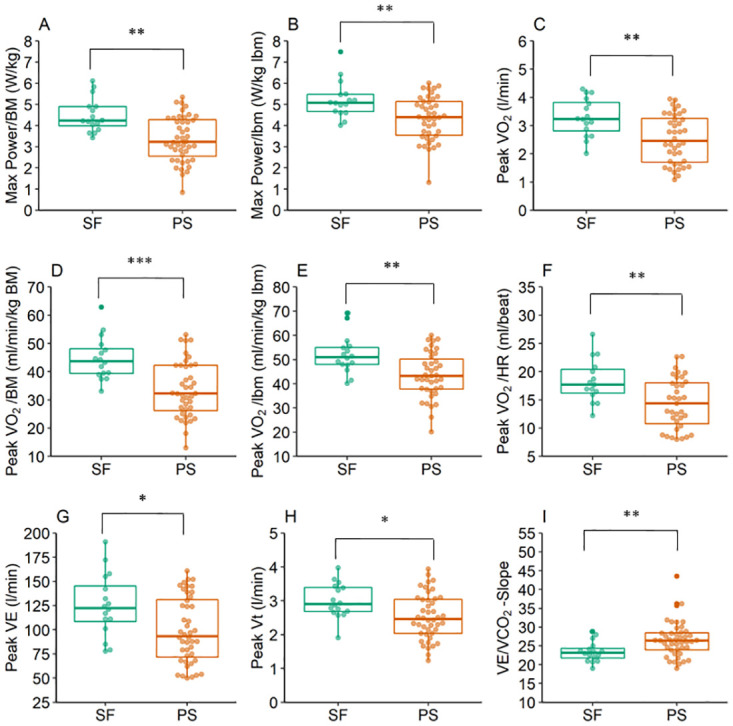
Fig 4. Differences in CPET between SF and PS at study inclusion.

SF (symptom-free) had significantly higher mean values for (A) Max Power/BM, (B) Max Power/lbm, (C) Peak VO2, Peak VO2/BM, (E) Peak VO2/lbm, (F) Peak VO2/HR, and (G) Peak VE at t0 (first examination date). PS (persistent symptoms) had higher mean value for (I) VE/VCO2-Slope compared to SF at t0. (H) Without confounder, a significantly higher mean value of Peak Vt in SF could be observed. *p<0.05, **p<0.01, ***p<0.001.
