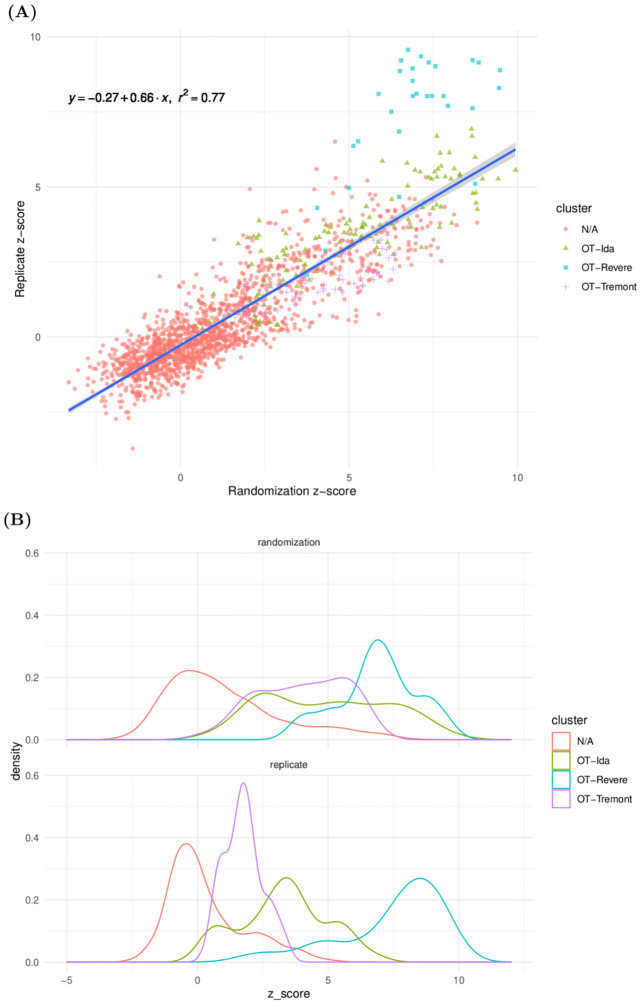
Fig 7. Visualizations of the relationship between replicate and randomization z-scores.
(A) Scatterplot of replicate z-scores versus randomization z-scores. (B) Marginal density estimates of replicate z-scores and randomization z-scores. We see strong evidence of a significantly positive linear relationship between these quantities, suggesting that our randomization procedure is able to identify significant differences between repertoire datasets.

