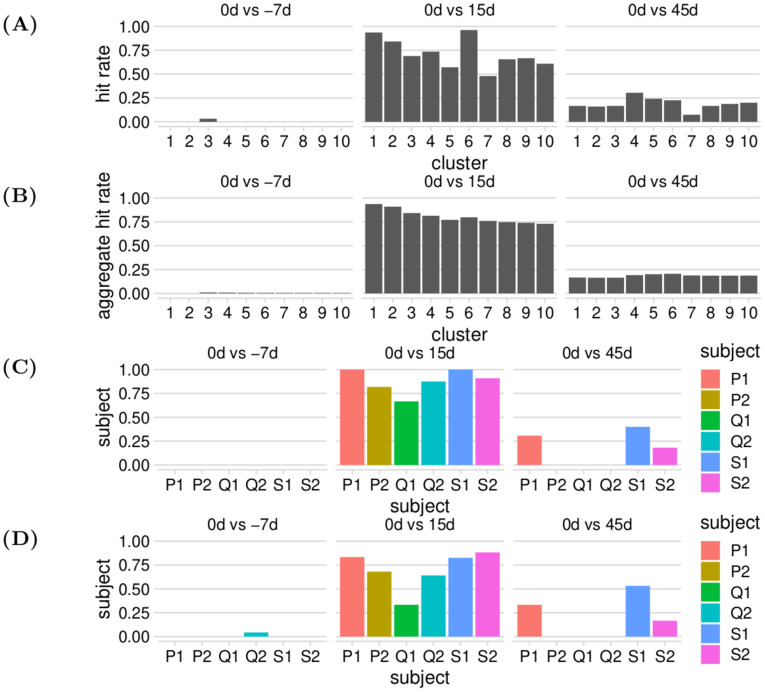
Fig 8. Various hit rate statistics for the YFV benchmark analysis.
(A) Hit rates of our responsive TCR inferences grouped by reference timepoint and cluster rank. (B) Aggregate hit rates of our responsive TCR inferences grouped by reference timepoint and cluster rank. (C) Hit rates of our responsive TCR inferences grouped by reference timepoint and donor, for cluster rank ≤2. (D) Hit rates of our responsive TCR inferences grouped by reference timepoint and donor, for cluster rank ≤10.

