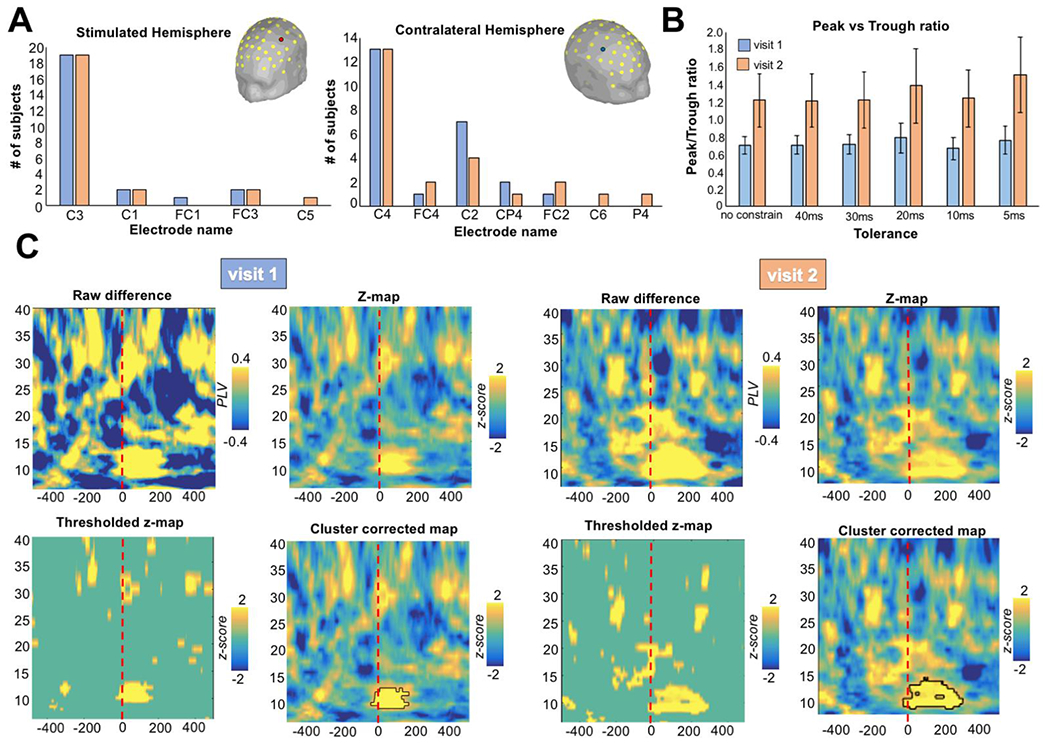
Figure 3. Time-frequency PLV results comparing trough vs peak for 5ms thresholds of sensitivity.

(A) In the majority of the subject and across visits, the electrode directly mostly affected by the TMS pulse was C3 (n: 19/24) for stimulated hemisphere and C4 (n: 13/24) for the contralateral hemisphere. (B) Ratio of trials classified as peak or trough considering different degree of temporal sensitivity in the trial split selection (from no constraint to a minimum of a 5ms window). (C) The time-frequency PLV for the thresholds of sensitivity of 5ms is shown. Raw difference plot represents the subtraction between trough vs peak trials. Then the time-frequency matrices for peak and trough were transformed into z-values (z-map plot) and statistically with respect to a null distribution of surrogate conditions difference values, obtained by swapping condition labels at each of 1000 permutations. The resulting z-scores were thresholded at p < .05 (thresholded z-map). Finally, a distribution of cluster sizes of contiguous significant points under the null hypothesis of no condition difference was computed, and only the time-frequency clusters that exceeded the 95th percentile of this distribution was retained (cluster corrected-map). Trough trials were observed to induce greater synchronization between the selected electrode in the μ-band compared to peak trials for both visit 1 and visit 2.
