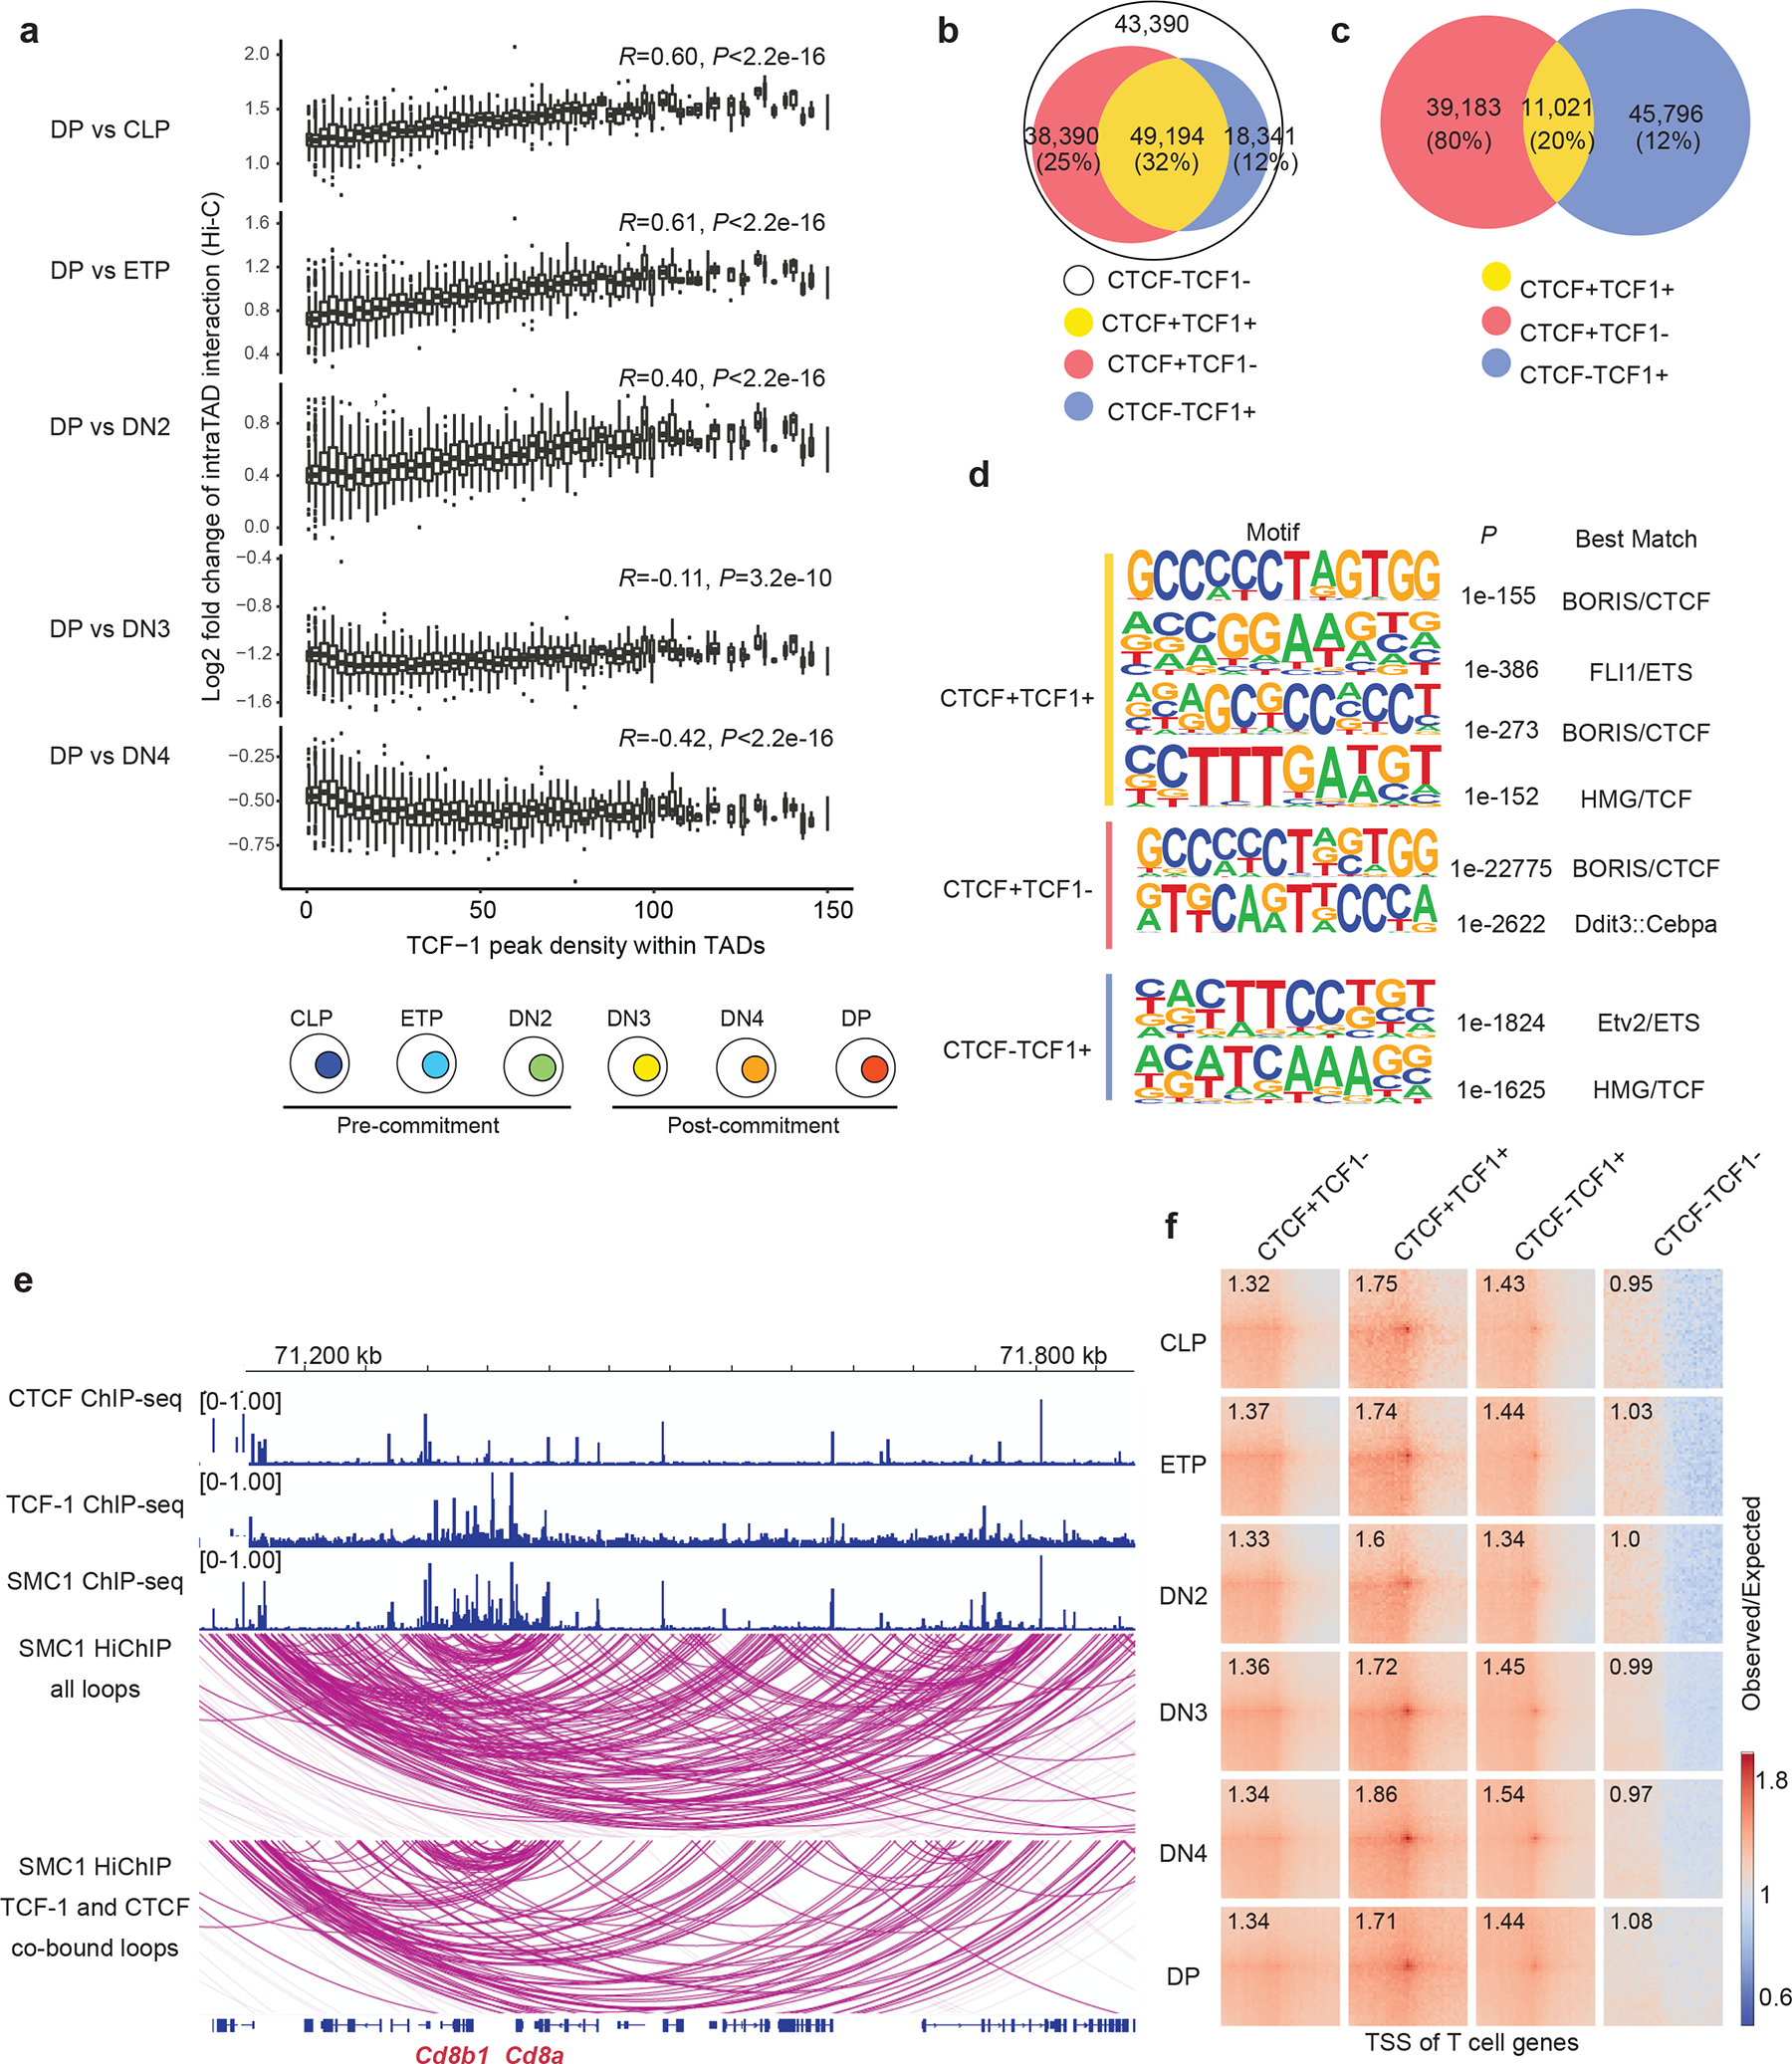
Fig. 1. TCF-1 is associated with intra-TAD interactions and cohesin loops.

a. Box plots showing the association between TCF-1 binding density and log2 fold change difference in intra-TAD interactions between DP and CLP-to-DN4 (bottom) and schematic of T cell developmental stages (top). Long range interactions at various T cell developmental stages were measured using Hi-C26. Intra-TAD interactions were calculated based on TADs detected in DP T cells (n=3023), and peak density were calculated with number of TCF-1 peaks per 1 Mbp region. TCF-1 peaks were defined from TCF-1 ChIP-seq in thymocytes25. Data are shown as boxplots (centre, median; box limits, upper (75th) and lower (25th) percentiles; whiskers, 1.5× interquartile range; points, outliers). P value was calculated with two-sided Spearman correlation. b. Venn diagram showing the total number of cohesin loops measured by SMC1 HiChIP and the proportion of them co-bound by CTCF and/or TCF-1 at least on one anchor. The four classes of peaks were defined using CTCF ChIP-seq in DPs29 and publicly available TCF-1 ChIP-seq in thymocytes25. c. Venn diagram showing the number of TCF-1 and CTCF peaks, and the overlap between them in DPs. d. Seq-logos demonstrating motif enrichment using random background based on homer analysis at TCF-1+CTCF, CTCF-only and TCF-1-only sites in DPs. P values are calculated using hypergenometric test. e. Genome browser view showing the association of CTCF and TCF-1 peaks with cohesin loops at the Cd8a and Cd8b1 locus. Loops co-bound by CTCF and TCF-1 at least on one anchor are shown in the bottom panel. f. Pileups of interactions between pairs of T cell developmental genes and CTCF only, TCF-1+CTCF, TCF-1-only peaks and random regions within 100kbp windows. T cell genes were defined from single-cell RNA-seq analysis of the thymus30 (“T Cell Subset Markers”, Table S2 in ref30). The number in each box indicates the strength of interaction at the center pairing TSS of T cell genes and different sets of peaks.
